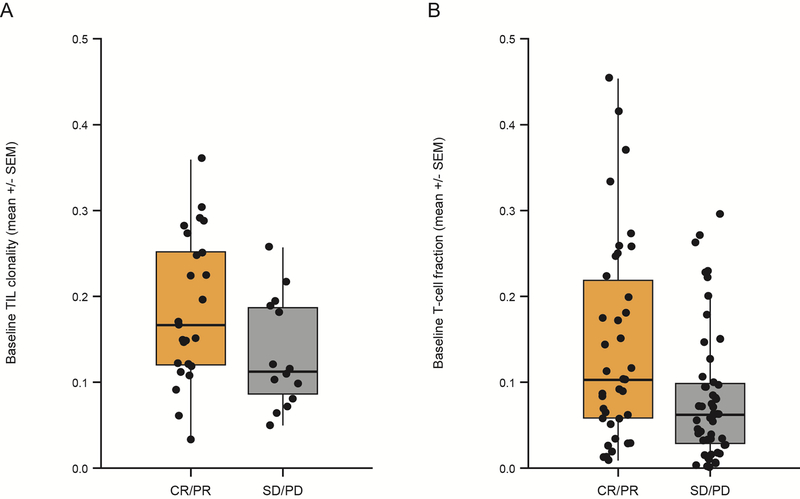
Fig 2.
Pretreatment TIL clonality in tumor samples of arm A, and pretreatment T-cell fraction in tumor samples from both arms A and B, correlated with clinical benefit (P = 0.04 with N = 30 and P = 0.02 with N = 89, respectively). (A) Pretreatment T-cell clonality. (B) T-cell fraction calculated as described in Patients and Methods is shown on a linear scale on the ordinate with response (CR + PR) versus non-response (SD + PD) shown on the abscissa. P values are determined from a Mann–Whitney U Test.

