
Figure 1.
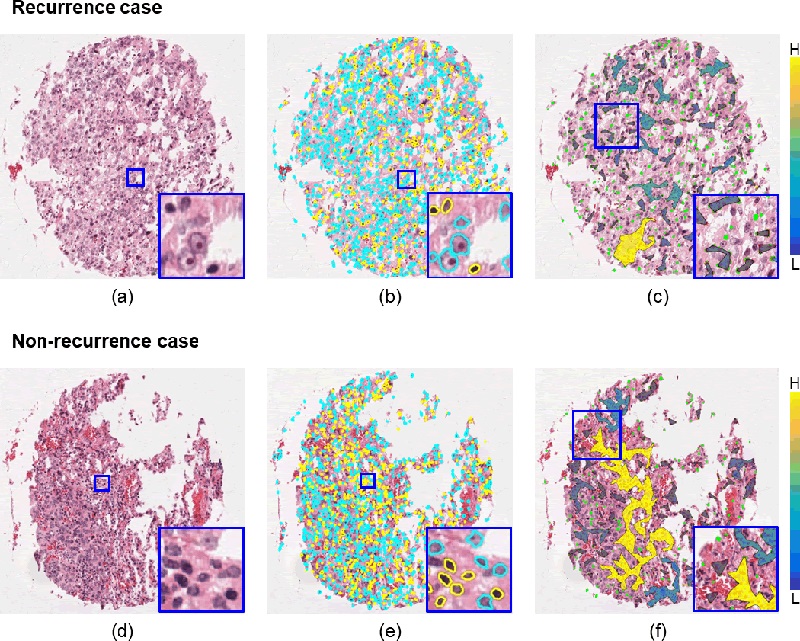
Representative TMA tissue spots of recurrent (top row) and non-recurrent (bottom row) early-stage NSCLC cases. The first column (a, d) shows the original H&E-stained images. Identification of TILs (yellow) and non-TILs (cyan) is presented in the second column (b, e). The third column (c, f) illustrates the qualitative representation of one of the SpaTIL features overlaid on the original images, specifically, the variation in the density of lymphocyte clusters. The color bars represent the density measurement (H stands for highly dense clusters while L stands for low-density or sparse clusters). Non-recurrence cases are characterized by the presence of more high-density clusters while recurrence cases were comprised of a larger number of low-density clusters.