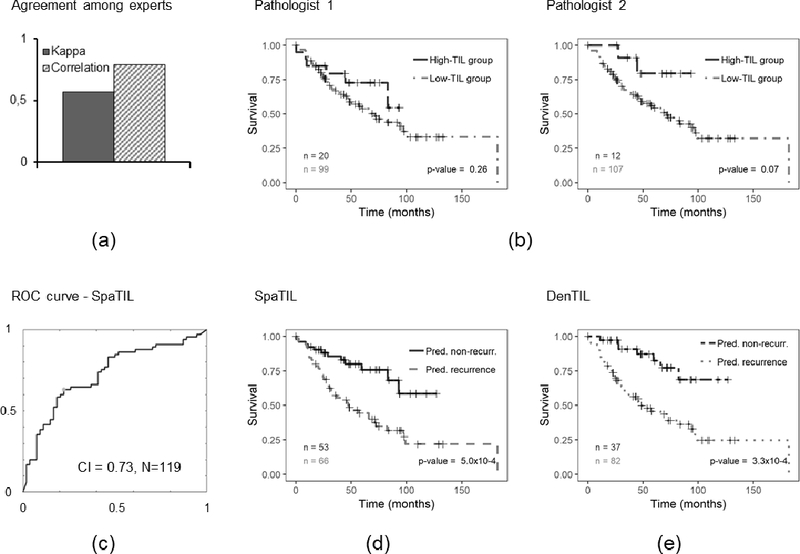
Figure 3.

Prognostic prediction results for human readers, QD, and QS for D2. a) Bar plot illustrating the Kappa index and correlation coefficient computed between readers 1 and 2, b) Kaplan-Meier curves for readers 1 and 2, c) ROC curve and corresponding CI for QS, d) Kaplan-Meier plot for QS classifier using recurrence free survival as endpoint, e) Kaplan-Meier plot for QD classifier. The number of cases in each category is indicated in the charts.
