
Figure 4.
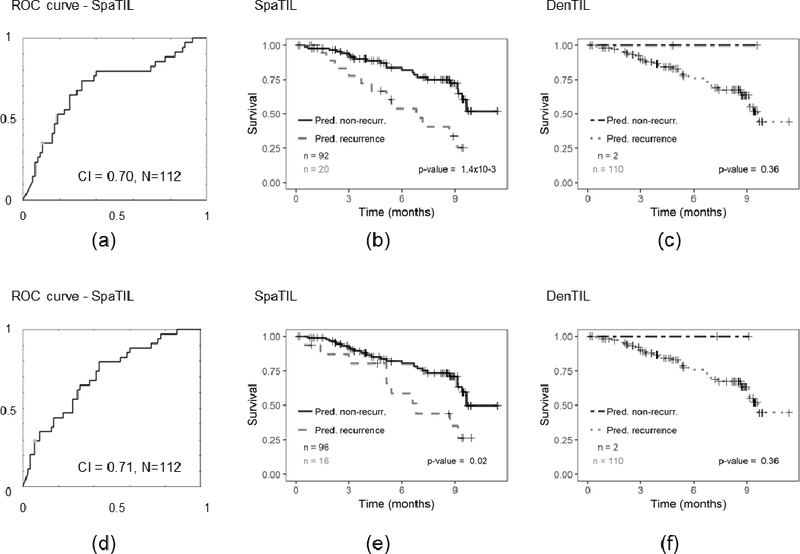
Prognostic prediction results for QD and QS for D3 (top row) and D4 (bottom row). First column (a, d) shows the ROC curve and corresponding CI for QS, second column (b, e) presents the Kaplan-Meier plots for QS classifier using recurrence free survival as endpoint, and third column (c, f) illustrates the Kaplan-Meier plot for QD classifier. The number of cases in each category is indicated in the charts.