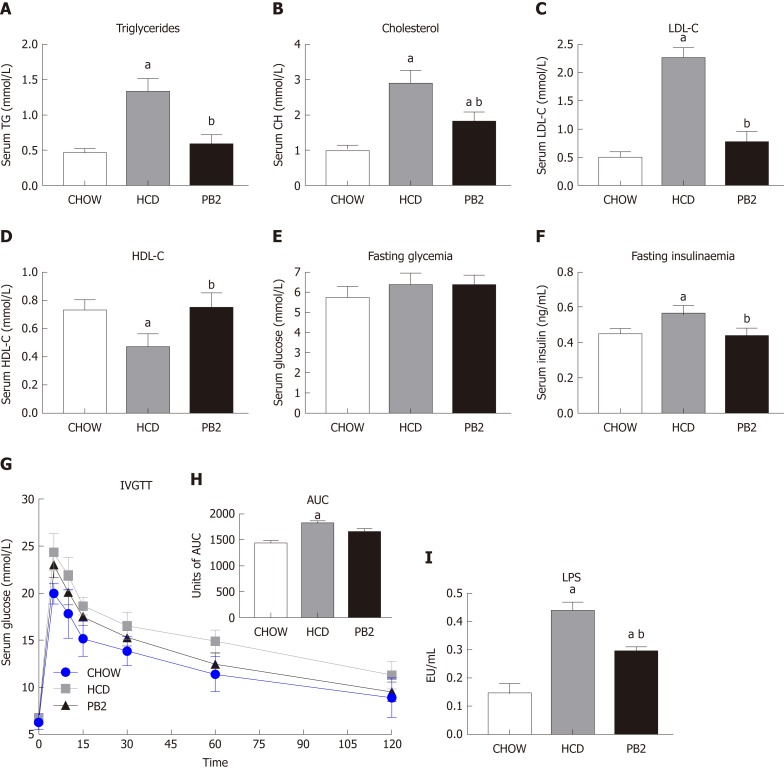
Figure 2.
Effects of procyanidin B2 on serum lipid profile, insulin resistance, and endotoxemia. Serum triglycerides (A), total cholesterol (B), low-density lipoprotein cholesterol (C), high-density lipoprotein cholesterol (D) and fasting glucose (E), fasting insulin (F) and the intravenous glucose tolerance test (G), units of area under the curve (H) and lipopolysaccharides (I). The data are expressed as means ± SD. aP < 0.05 vs CHOW group; bP < 0.05 vs high-fat-cholesterol diet group. HCD: High-fat-cholesterol diet; PB2: Procyanidin B2; LDL-C: Low-density lipoprotein cholesterol; HDL-C: High-density lipoprotein cholesterol; IVGTT: Intravenous glucose tolerance test; AUC: Area under the curve; LPS: Lipopolysaccharides; SD: Standard deviation.

