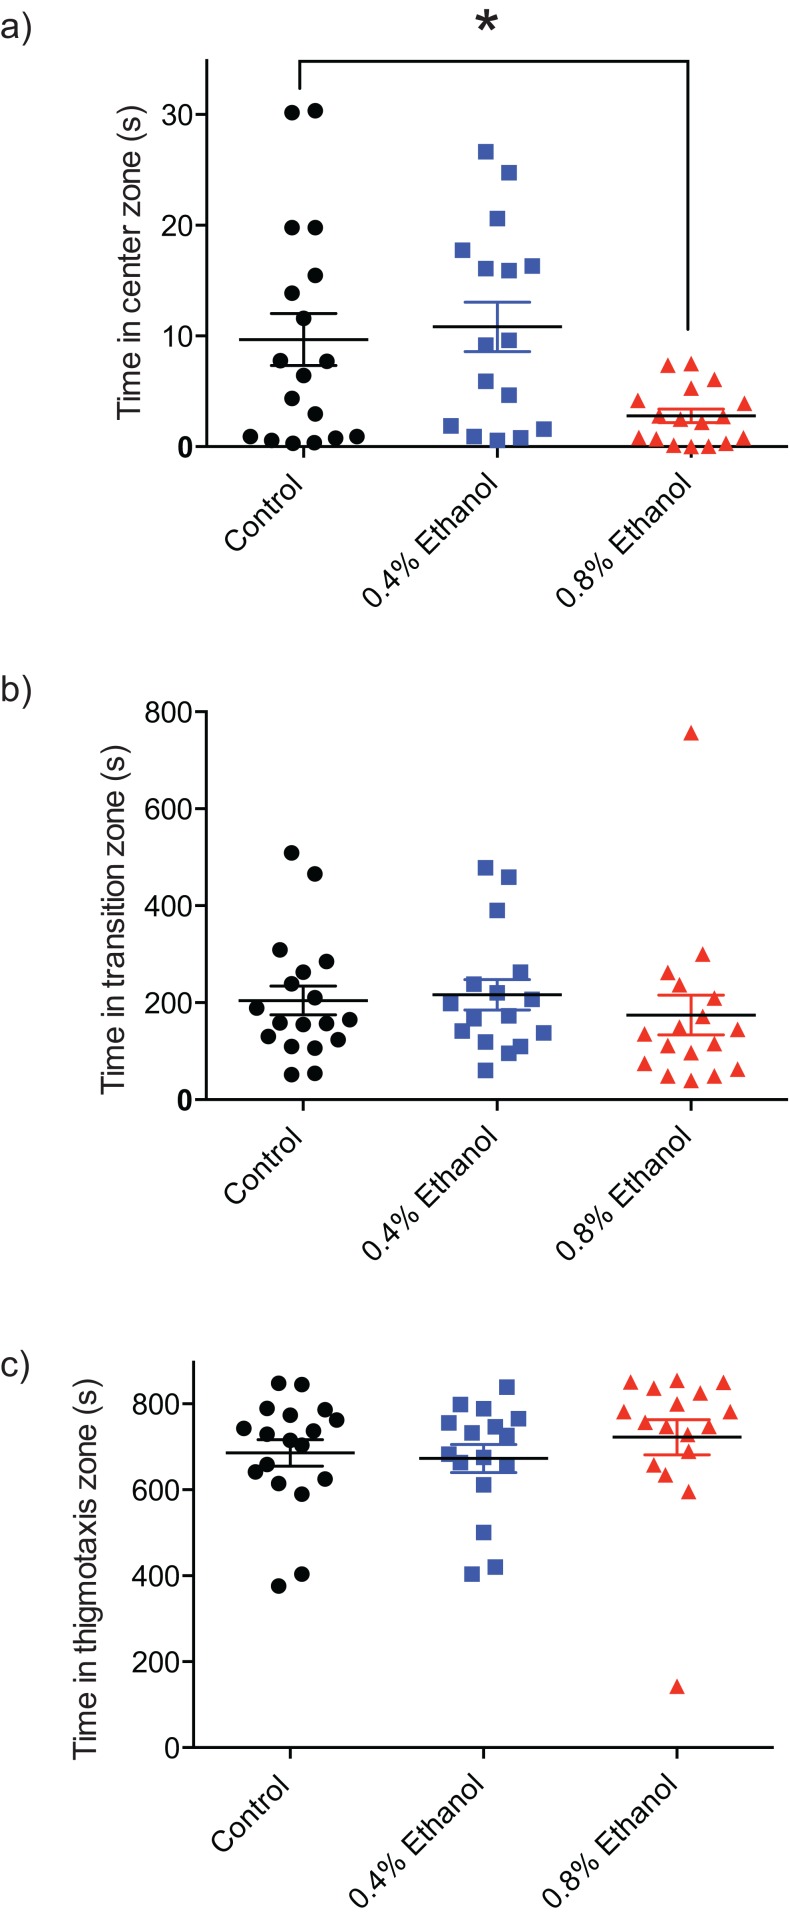
Figure 2. Repeated ethanol administration effects on time in zones during withdrawal.
Each data point represents an individual fish. (A) Time in centre zone is decreased with 0.8% ethanol. (B) No effect on time spent in transition zone. (C) No effect on time spent in thigmotaxis zone. *P < 0.05. Mean ± S.E.M.

