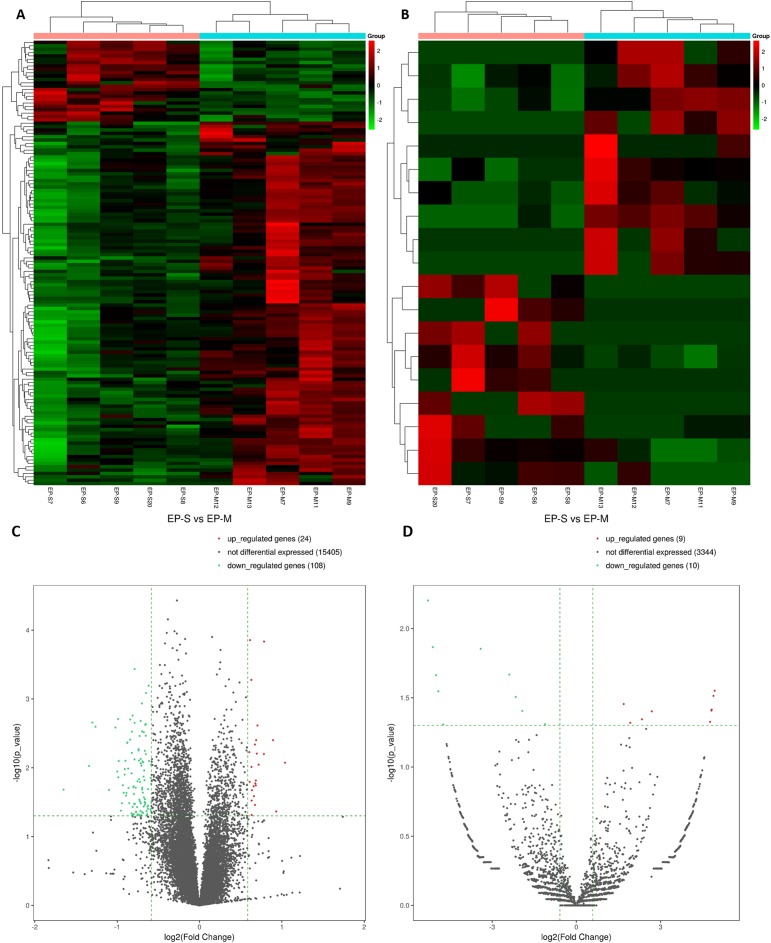
Figure 1. Analysis of DEmRNAs (A, C) and DEcircRNAs (B, D).
Hierarchical clustering. Each row represents an mRNA and each column represents a sample. Green and red represent down-and up-regulated mRNAs or circRNAs, respectively. Genes in the volcano-Plot above the green parallel line (p < 0.05) and outside the two longitudinal green lines indicated DEmRNAs and DEcircRNAs between the two compared samples.

