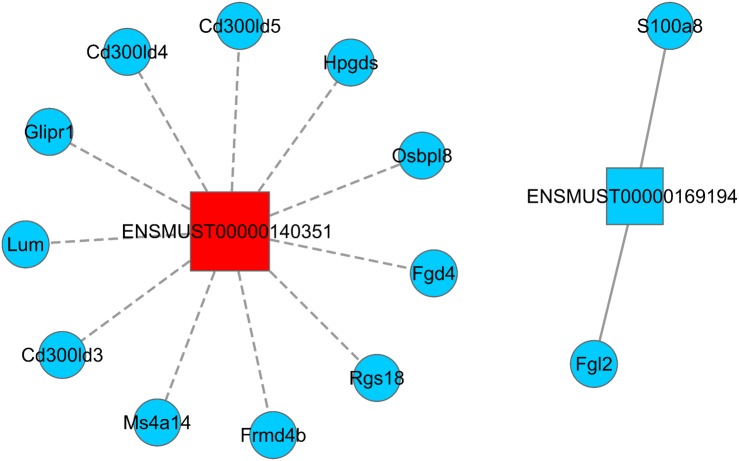
Figure 4. LncRNA–mRNA regulatory network (ENSMUST0000140351 and ENSMUST00000169194).
Squares represent lncRNAs, circles represent mRNAs; red indicates up-regulated expression and blue indicates down-regulated expression. The solid line is positively correlated and the dotted line is negatively correlated. LncRNA–mRNA regulatory network was constructed using Cytoscape v2.8.2 software.

