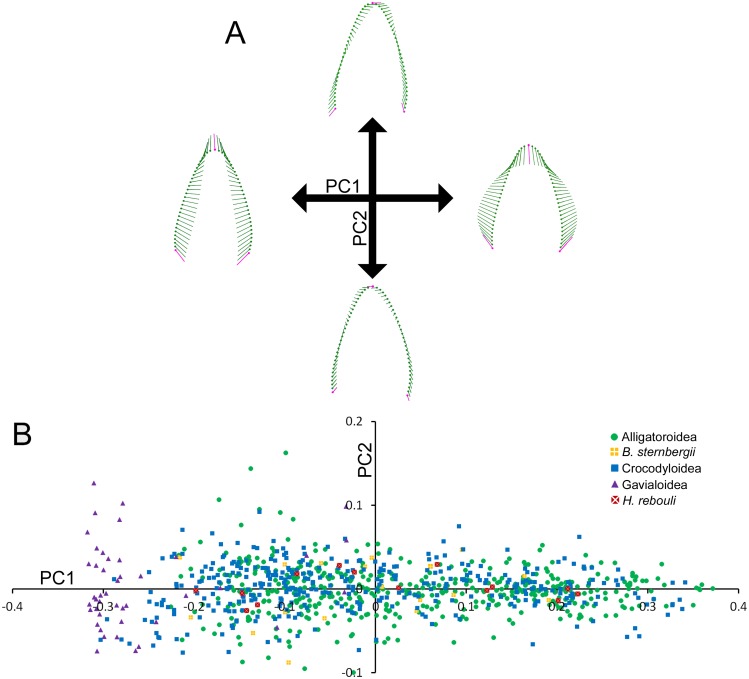
Figure 2. Variability within the first principal component for teeth.
(A) Vector diagrams indicate the maximum range of variance (vectors) from the mean (points) for both cranial and dentary teeth. Landmarks are in magenta and semilandmarks are in green. (B) Scores from the first and second principal components are plotted in a morphospace, with major taxonomic groupings labeled.

