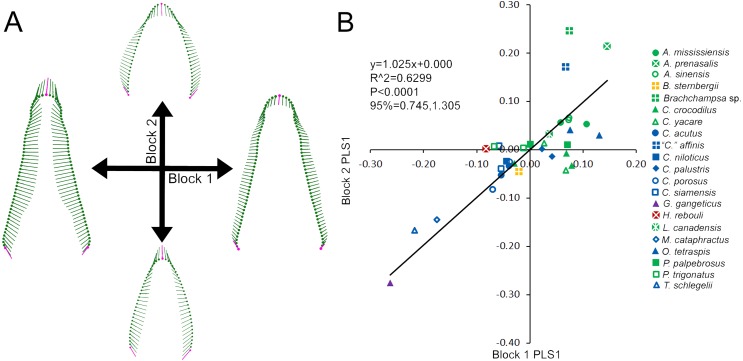
Figure 3. Partial Least Squared (PLS) two-block analysis of shape.
(A) Vector diagrams indicate shape variance of PLS1 for skull shape (Block 1) and average tooth shape (Block 2). (B) PLS1 scores for both blocks were regressed, with colors and shapes representing species. Regression information is listed.

