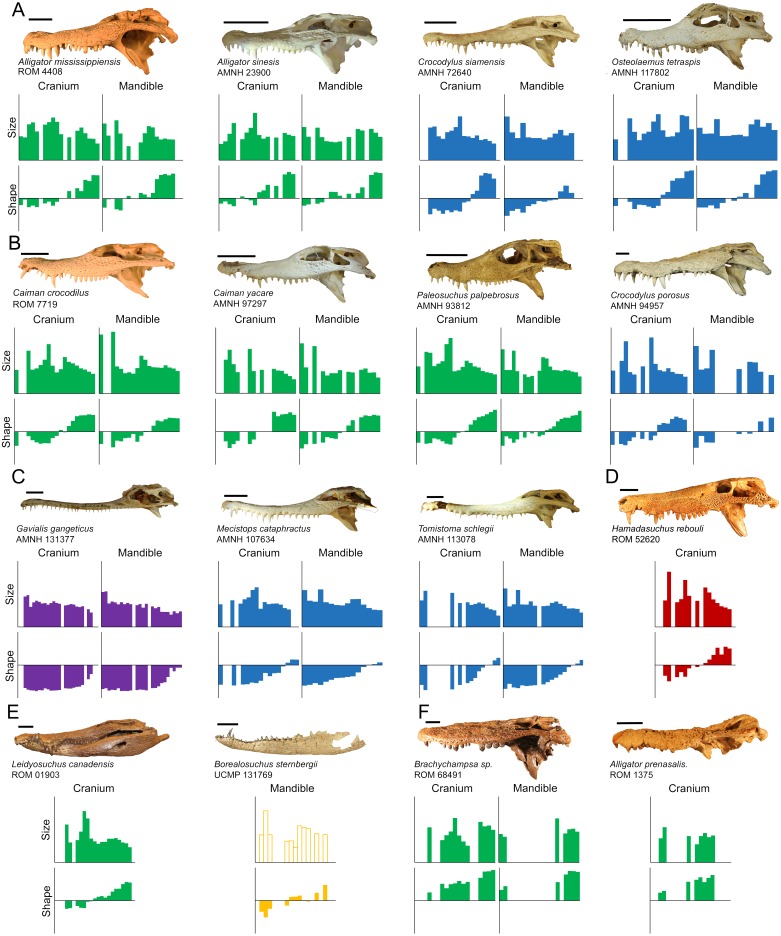
Figure 7. Direct comparisons between selected extant and extinct taxa.
The size axis represents normalized centroid size (ranging from 0.00 to 0.20), and the shape axis represents scores from the first principal component (ranging from −0.04 to 0.04). Taxa are grouped by (A) modern specimens with high molariform distal teeth, (B) modern specimens that display high size heterodonty, (C) slender-snouted specimens, (D) Hamadasuchus rebouli, (E) Borealosuchus sternbergii and Leidyosuchus canadensis, and (F) fossil globidont specimens. (Note: Borealosuchus sternbergii teeth were not size normalized by its own skull length, as indicated by hollow bars). Scale = 5 cm.

