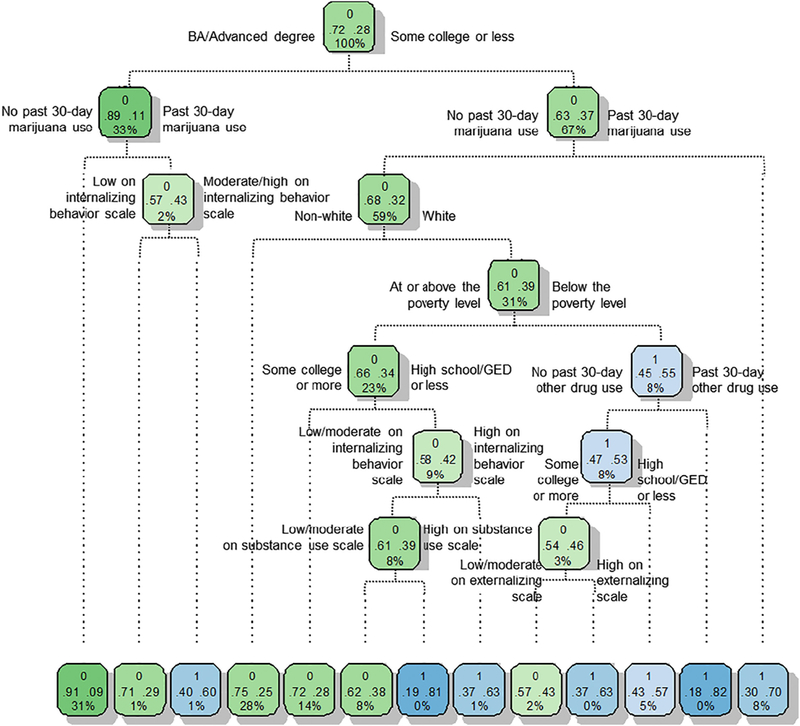
Fig. 2.

Young adults aged 25–34, Wave 1 of the Population Assessment of Tobacco and Health (PATH) Study, 2013–2014. Pruned, weighted classification and regression tree (CART) model of associations between current cigarette smoking and the following risk factors: sex, LGBQ status, race/ethnicity, educational attainment, poverty status, census region, past 30-day alcohol use, past 30-day marijuana use, past 30-day any other drug use, any medical comorbidity, and the GAIN-SS internalizing, externalizing, and substance use scales. Results from a saturated model were “pruned” using CART analytic software to reduce complexity (R Core Team, 2017). Rectangles (nodes) represent smoking prevalence for the entire population (top-most node) or population subgroups (all others nodes). Nodes also list the proportion of the adult population represented. Green nodes depict subpopulations where the majority of the population is non-smokers and blue nodes, subpopulations where the majority of the population is current smokers. Using the root node as an example, 72% of young adults aged 25–34 are non-smokers, 28% current smokers, and this node represents 100% of the U.S. young adults aged 25–34. Lines below nodes represent the binary branching around particular risk factors and risk-factor levels. The bottom row comprises terminal nodes (i.e., final partitioning for a particular subgroup). Terminal nodes contain the same information as the other nodes plus the percent of all adult current smokers represented by that node. Percent of current smokers represented is calculated by the following equation: % total population represented by a node × smoking prevalence in that node/smoking prevalence in the entire study sample × 100. Tallying % current smokers represented across all terminal nodes should equal 100% of smokers in the U.S adult population, save rounding error. (For interpretation of the references to colour in this figure legend, the reader is referred to the web version of this article.)
