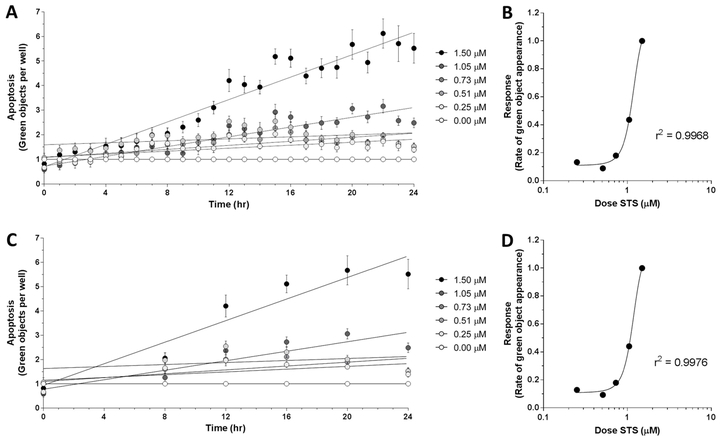
Figure 1.
Apoptotic response in C57BL/6J MLFs, as quantified by IncuCyte S3 Live-Cell Analysis System. Cells were seeded at 35,000 cells/mL in 96-well plates and treated with doses of staurosporine (STS) ranging from 0.00 μM to 1.50 μM, as well as 1X IncuCyte® Caspase-3/7 Green Reagent. Using the IncuCyte® S3 Live-Cell Analysis System and accompanying software (v2017A), cellular apoptosis was assessed hourly over 24 hr by quantifying number of green objects per well (A). Rates of apoptosis in response to each dose of STS were determined by linear regression and plotted against corresponding dose of STS (B). Timecourse of apoptotic response showing fewer timepoints (0 hr, 8 hr, 12 hr, 16 hr, 20 hr, and 24 hr) is shown in C, with corresponding dose-response relationship shown in D. Goodness of fit for dose-response curves in B and D (r2 = 0.9968 and 0.9976, respectively) were determined by sigmoidal least squares nonlinear regression. Values for each timepoint in A and C represent mean and SEM of 3 replicates and are normalized to control wells (0.00 μM STS) to control for baseline apoptosis over 24 hr.

