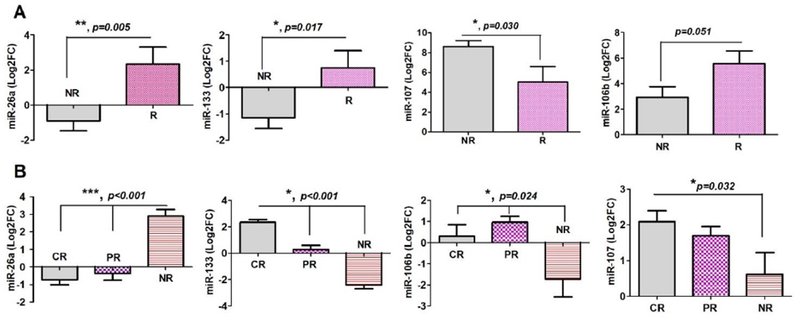
Figure 3.

The differential expression of miRs in TACE-responder versus non-responders. The expression of miRs in FFPE tissues specimens (A) and serum samples (B) procured from HCC patients was evaluated by qPCR analysis. Bar charts of Log2FC values represented the differentially expression of four miRs in tissues and sera of TACE-responders (R) or partial responders (PR) compared to non-responders (NR) as described in the patients’ section. The Y-axis represents Log2FC normalized against internal control (RNU6-1) and the baseline expression in normal subjects. The mean Log2FC of the two groups compared by student t-test (two-tailed) and the significance level
