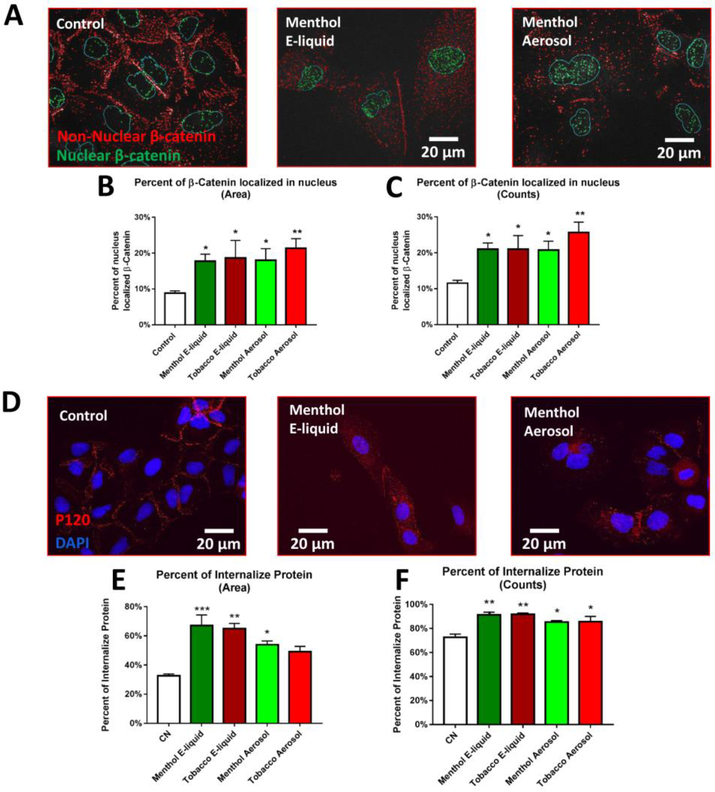
Figure 5: Translocation of Two Catenin-Family Transcription Factors.
(A) Active β-catenin in the nucleus (green) and cytoplasm (red) in segmented images. (B-C) Quantification of percent area and counts of active β-catenin puncta inside the nucleus. Each error bar is the mean ± SEM of six independent experiments. One-way ANOVA with Dunnett’s post hoc test was performed on B and C arcsine-transformed percent data; treated groups were compared to the control. (D) 8-day treated A549 cells immunolabeled with P120. (E-F) Quantification of the percent area and counts of internalized P120. Each error bar is the mean ± SEM of three independent experiments. One-way ANOVA with Dunnett’s post hoc test was performed on E and F. Asterisks on top of each bar indicate the statistical significance. (* = p < 0.05. ** = p <0.01. *** = p <0.001.).

