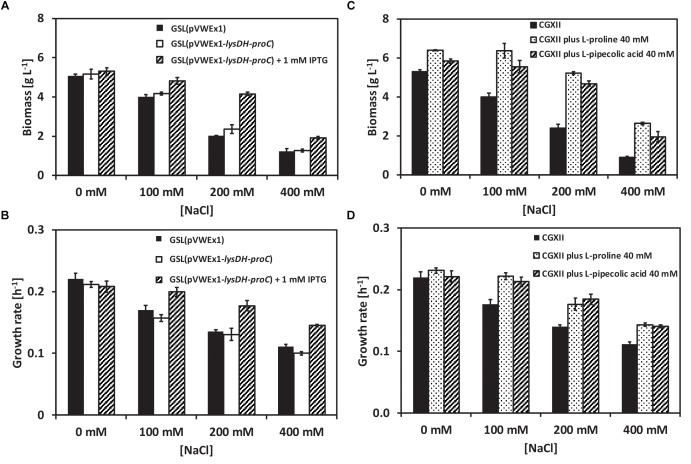
FIGURE 1.
Growth of the C. glutamicum strains GSL(pVWEx1) and GSL(pVWEx1-lysDH-proC) under different osmotic conditions. (A) Biomass formation in g L-1 of GSL(pVWEx1) and GSL(pVWEx1-lysDH-proC) strains in glucose minimal medium supplemented with 0, 100, 200, or 400 mM of NaCl. (B) Growth rates values in h-1 of GSL(pVWEx1) and GSL(pVWEx1-lysDH-proC) strains in glucose minimal medium supplemented with 0, 100, 200, or 400 mM of NaCl. (C) Biomass formation in g L-1 of GSL(pVWEx1) strain in glucose minimal medium supplemented with 0, 100, 200, or 400 mM of NaCl with 40 mM of L-proline or 40 mM of L-PA or nothing. (D) Growth rates values in h-1 of GSL(pVWEx1) strain in glucose minimal medium supplemented with 0, 100, 200, or 400 mM of NaCl with 40 mM of L-proline or 40 mM of L-PA or nothing. Values represent means and standard deviations.

