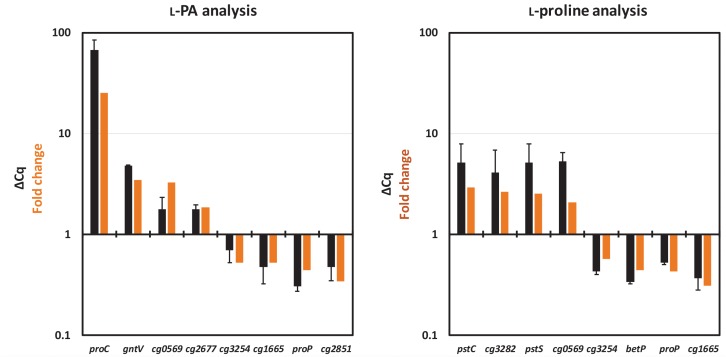
FIGURE 3.
Comparison of relative gene expression values obtained by qRT-PCR analysis (black bars) with those obtained by RNAseq analysis (orange bars). RNAseq data from Table 5 and qRT-PCR data (ΔCq) collected for the L-PA analysis (left) and for the L-proline analysis (right) are listed. The values from the qRT-PCR are given as means and standard deviations.

