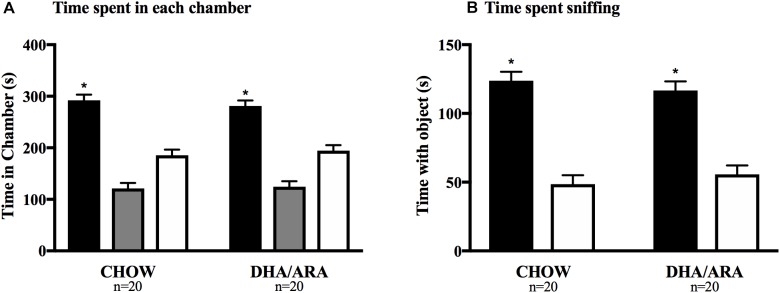
FIGURE 10.
Three-chamber Social Interaction test. (A) Time spent in each chamber (black bars represent side chambers with novel mouse; gray bars represent middle chambers; and white bars represent chambers without a mouse). (B) Time spent sniffing novel mice (black bars) and empty container (white bars). Shown are mean ± standard error. The asterisks (∗) represent P < 0.001 for the main effect (CHOW and DHA/ARA combined) comparing time spent in chambers with novel mouse and the middle and empty chambers, from a repeated-measures general linear model.

