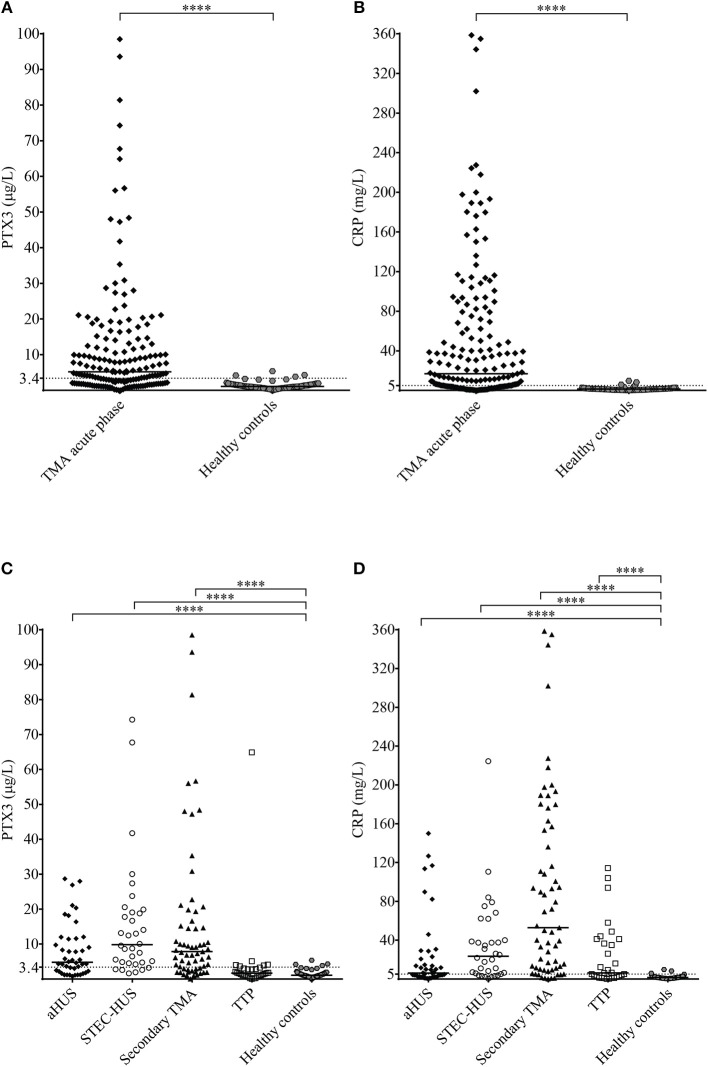
Figure 2.
PTX3 and CRP levels in acute TMA vs. healthy controls. (A,B) PTX3 and CRP levels of TMA patients at the acute disease onset compared to pentraxin levels of healthy individuals. (C,D) PTX3 and CRP levels of acute phase-TMA patients grouped by disease etiology. Data are expressed as mean of technical duplicates, the horizontal line indicates the median of each group, while an intermittent line shows the calculated cutoff of each pentraxin, respectively. Statistical analysis was performed with the Mann Whitney test (A,B) or the Kruskal-Wallis test corrected for multiple comparisons using the Dunn's post hoc test (C,D), respectively. Statistical significance is indicated by asterisks (****p < 0.0001). aHUS, atypical hemolytic uremic syndrome; CRP, C-reactive protein; PTX3, pentraxin-3; STEC-HUS, Shiga-like toxin associated HUS; TMA, thrombotic microangiopathy; TTP, thrombotic thrombocytopenic purpura.

