FIGURE 11.

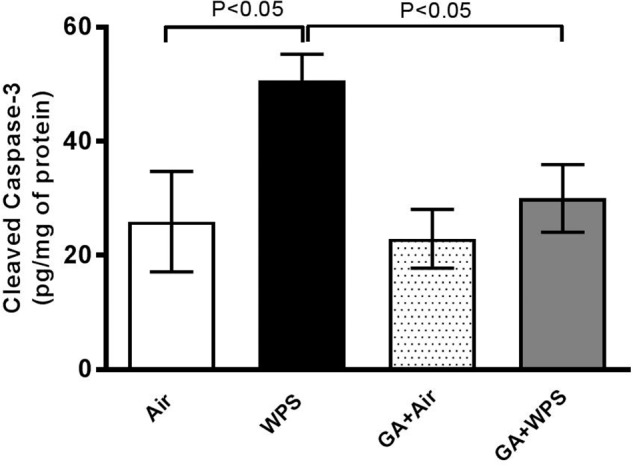
Heart homogenate concentrations of cleaved caspase-3 at the end of 1 month exposure period to either air (n = 6) or WPS (n = 8) or GA administration (15% w/v in the drinking water) + air (n = 6) or GA + WPS (n = 7). Data are mean ± SEM.

Heart homogenate concentrations of cleaved caspase-3 at the end of 1 month exposure period to either air (n = 6) or WPS (n = 8) or GA administration (15% w/v in the drinking water) + air (n = 6) or GA + WPS (n = 7). Data are mean ± SEM.