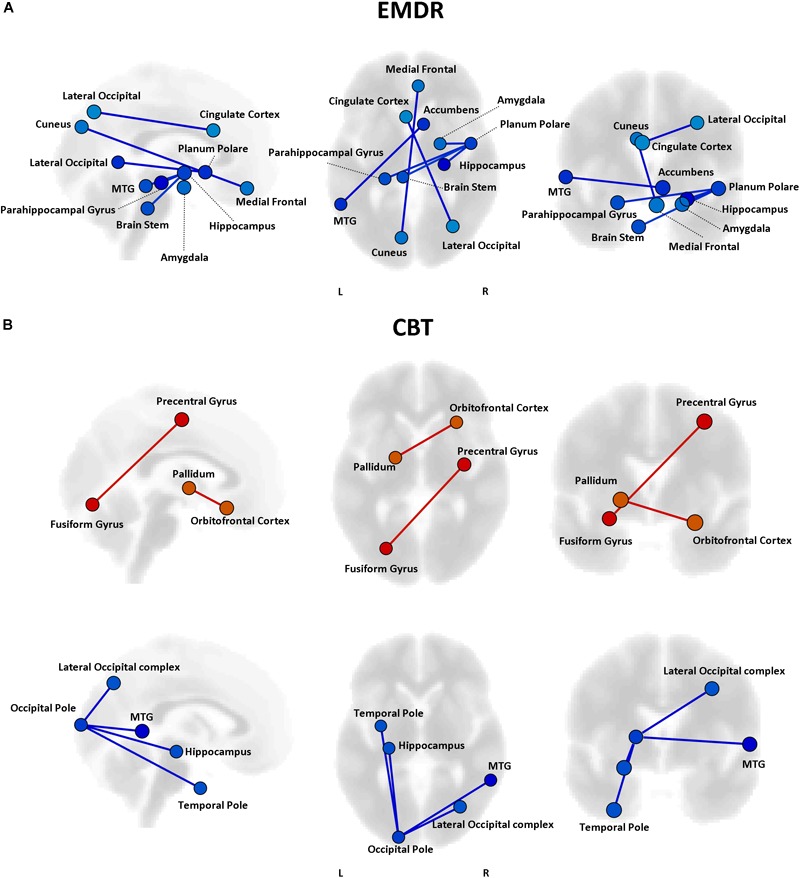
FIGURE 4.

Functional connectivity and WSAS changes. Results of the repeated measures ANCOVA on pairwise connectivity and WSAS scores are displayed for patients in the EMDR (A) and TF-CBT (B) groups. Significant changes are displayed separately for increased (red) and decreased (blue) connectivity, with edges representing connections with a p < 0.05 FDR corrected. No increase in connectivity accompanied changes in WSAS in the EMDR group. The strength of pre–post changes in connectivity is color-coded for both edges and nodes (yellow → red, stronger increase in connectivity; cyan → blue, stronger decrease in connectivity). Images are displayed in neurological convention. MTG, Middle Temporal Gyrus; FDR, False Discovery Rate.
