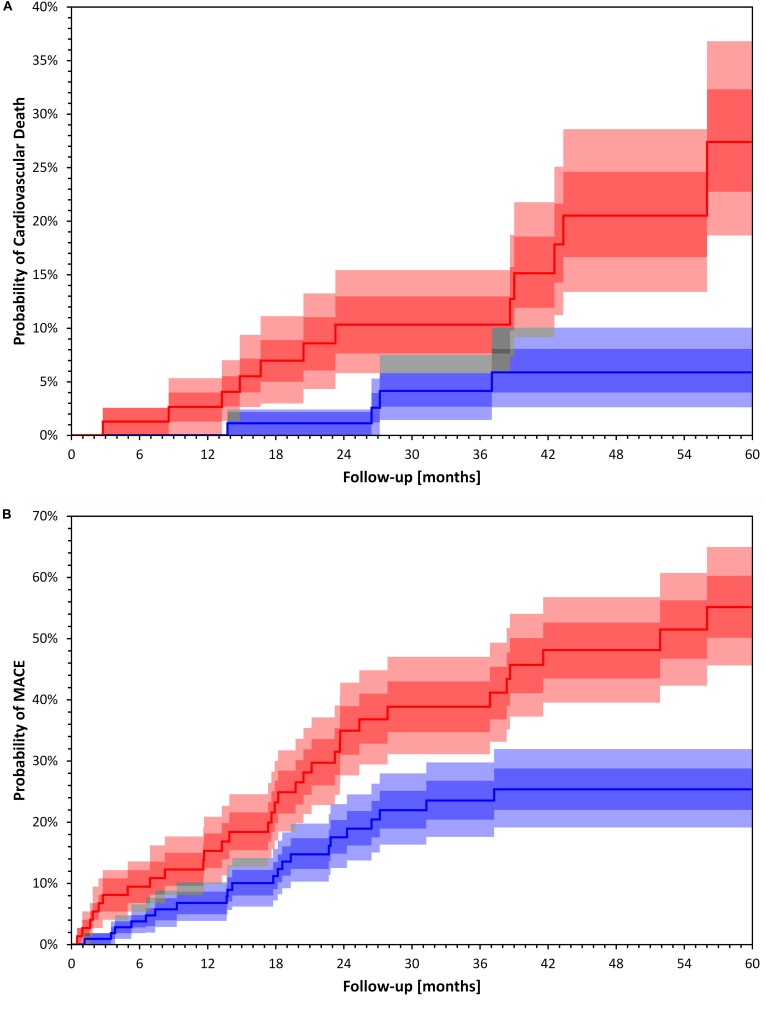
FIGURE 3.
Kaplan Meier event probability curves for Cardiac Death (A) and Major Cardiac Events (B). Kaplan Meier event probability curves for Cardiac Death (A) log rank p = 0.004 and Major Cardiac Events (B) log rank p = 0.002 for patient groups stratified by a TCRT above and below 100°. Bands represent interquartile ranges (IQR) (darker colors) and 80% percentiles (lighter colors). The gray areas show the overlaps. The dark, middle and light gray correspond to overlaps of IQRs, IQR+80% and 80%+80%, respectively. The bands have been calculated with bootstrap with 10000 random repetitions.

