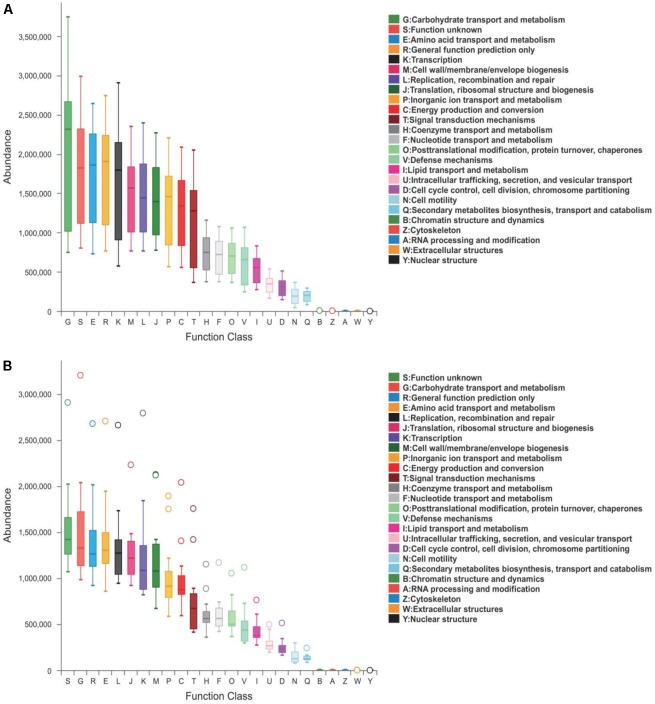
FIGURE 5.
COG functional classification in (A) healthy and (B) diarrhea piglets. Boxes represent the interquartile range (IQR) between the first and third quartiles. The lines and spots inside the boxes represent the median and mean, respectively. Whiskers denote the lowest and highest values within 1.5 × IQR from the first and third quartiles, respectively. The ring above the box indicates the outliers.

