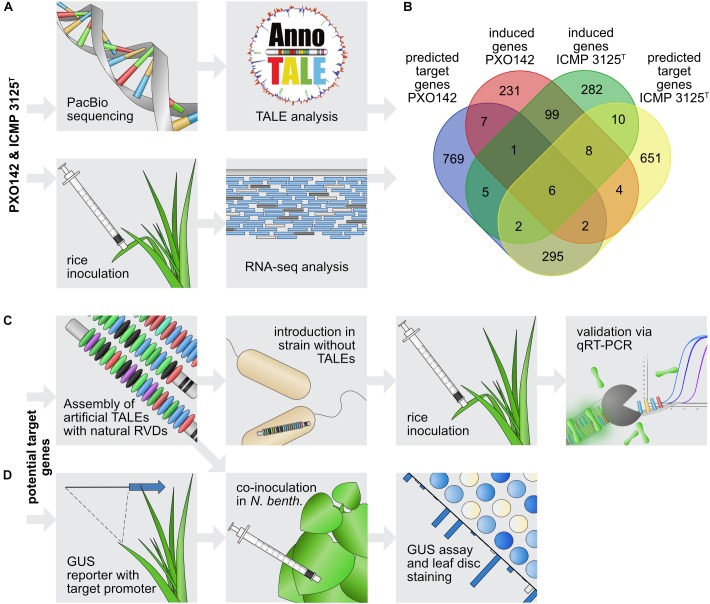
FIGURE 3.
Workflow of TALE target gene identification. (A) Identification of candidate target genes. The top panel describes the steps for in silico predictions and the bottom panel shows the in vivo transcriptome analysis. (B) Venn diagram of intersections between predicted target genes and genes induced upon Xoo infection. (C,D) Strategy to evaluate individual candidate target genes. (C) Steps to identify the influence of single TALEs on target gene expression. (D) Steps to assess interactions between individual TALEs and their respective target promoters.

