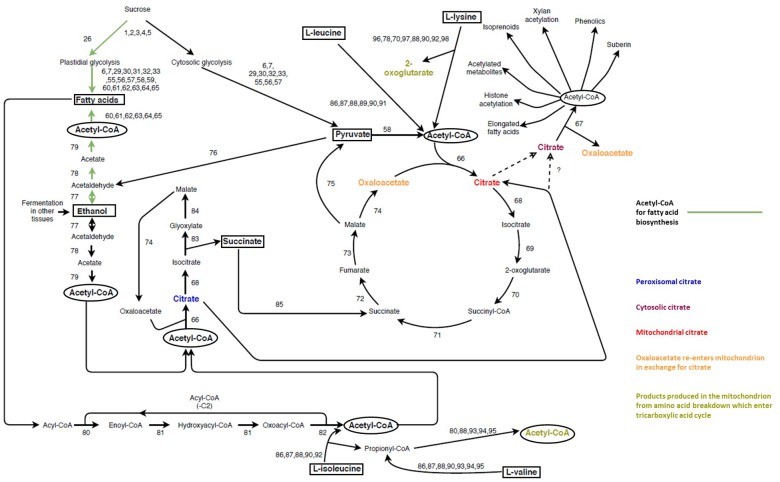
FIGURE 6.
Multiple metabolic sources of plastidial and cytosolic acetyl-CoA. Plastidial glycolysis contributes pyruvate which is converted to acetyl-CoA by the plastidial Pyruvate Dehydrogenase (PDH) (58) complex for fatty acid biosynthesis (Johnston et al., 1997; Lin et al., 2003; green arrows) whereas cytosolic glycolysis is the main metabolic route which contributes pyruvate toward the TCA cycle for respiration in the mitochondrion (Luethy et al., 1995). In the mitochondrion, the pyruvate is broken down to acetyl-CoA which forms part of the TCA cycle through the action of CITRATE SYNTHASE (66) which produces mitochondrial citrate (red) from acetyl-CoA and oxaloacetate. Mitochondrial citrate (red) is transported to the cytosol (purple) and converted by heteromeric ATP-CITRATE LYASE (67) into acetyl-CoA and oxaloacetate. This is the main source of cytosolic acetyl-CoA pool whereas the resulting oxaloacetate is transported back into the mitochondrion in exchange for more citrate (orange). Acetaldehyde derived either from fermentation or from ethanol from other tissues can either enter the plastid where it contributes to fatty acid biosynthesis (green arrows), or be converted to acetate in the cytosol and enter the peroxisome. Acetyl-CoA can be generated in the peroxisome from acetate (79), β-oxidation of fatty acids (80–82), or breakdown of isoleucine (82, 86, 87, 88, 90, 92). The peroxisomal acetyl-CoA produced from the three aforementioned pathways can contribute to the cytosolic acetyl-CoA through the TCA either as citrate (blue) or succinate from the glyoxylate cyle (85). The breakdown of amino acids in the mitochondrion supplies various TCA cycle intermediates (gold) which can either contribute to respiration or the cytosolic acetyl-CoA pool. Unidirectional arrows indicate irreversible reactions, bidirectional arrows indicate reversible reactions whereas lines with multiple numbers next to it indicates multiple enzymatic reactions. Key metabolites are highlighted in square boxes, whereas acetyl-CoA is highlighted by ovals. The enzyme represented by each number can be found in Supplementary Table S1, along with additional information such as gene ID and cellular localization with steps 55–98 being displayed above. Several enzymatic steps are repeated from and Figure 4, 5.

