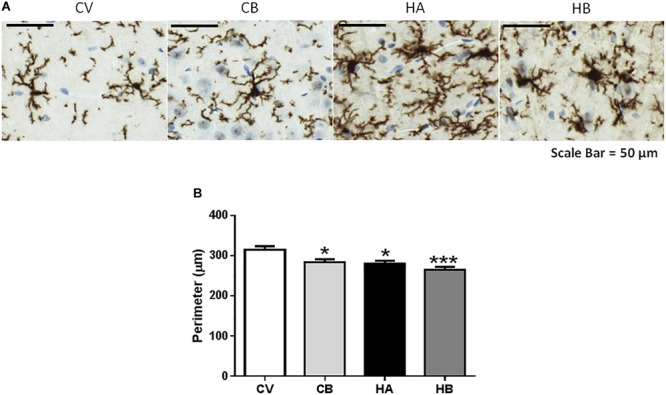
FIGURE 2.

Effect of bicuculline on microglia activation in CA1 region of the hippocampus. Immunohistochemistry was performed as indicated in Section “Materials and Methods” using antibody against Iba1. Representative images of microglial activation (A) are shown. Scale bar = 50 um. The perimeter of microglia stained with Iba1 was quantified as described in methods as a measure of microglia activation. (B) Data are the mean ± SEM of 10 rats per group. Values significantly different from control rats are indicated by asterisks. ∗p ≤ 0.05. CV, control vehicle; CB, control treated with bicuculline; HV, hyperammonemic rats with vehicle; HB, hyperammonemic rats treated with bicuculline. ∗∗∗p < 0.001.
