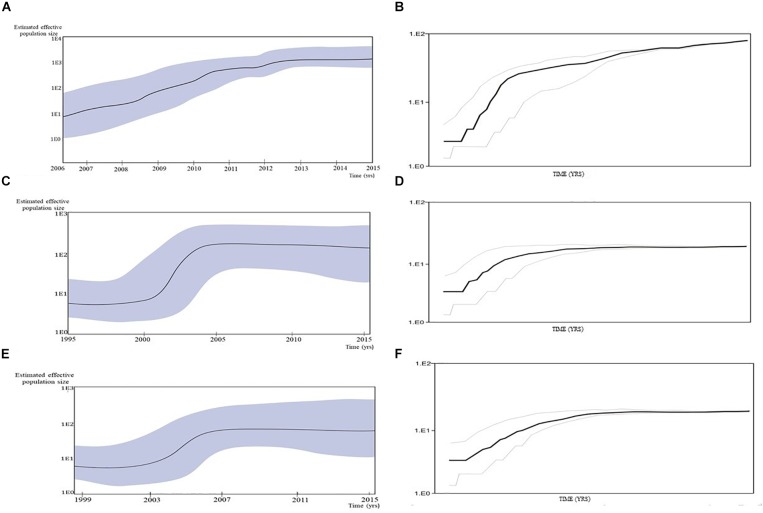
FIGURE 4.
Population growth and the cumulative number of lineages (infections) in a logarithmic scale over time for the (A,B) transmission cluster of 15 sequences; (C,D) transmission network; (E,F) transmission cluster of 11 sequences. The median estimate of the effective number of infections (solid line) and 95% confidence limits of the estimate (dashed lines) are shown in each graphic.

