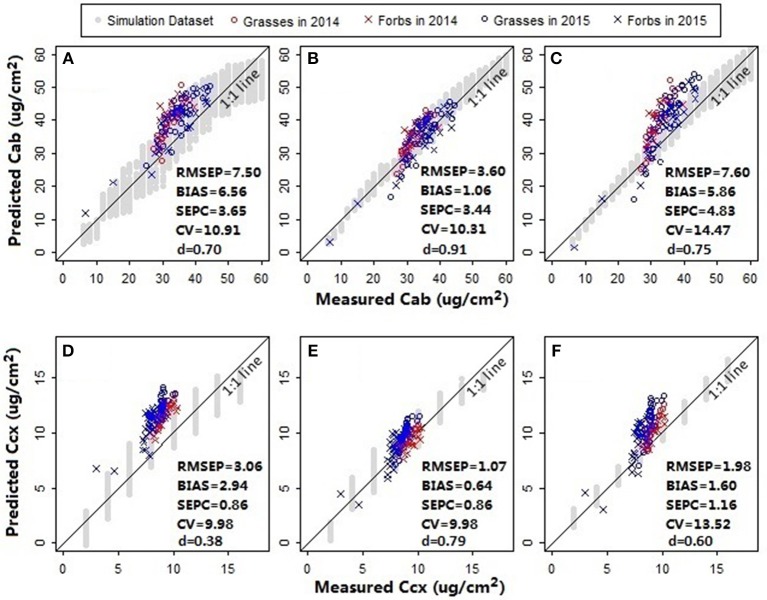
Figure 7.
Model assessment for (A–C) chlorophylls and (D–F) carotenoids. Prediction accuracies of models with different leaf structure parameter ranges and spectral variables were compared. For the models in plots (A,D), the leaf structure parameter N ranged between 1.5 and 3; the spectral variables NDR470–NDR800, S1–S3, D1, and D2 were included as the manifest explanatory variables for PLS regressions. In plots (B,E) N was adjusted within a range between 1.7 and 1.9; the spectral variables were the same with that in plots (A,D). In plots (C,F) N ranged between 1.7 and 1.9; the manifest explanatory variables included NDR470–NDR800, whereas the slope and distance spectral variables were excluded. The RMSEP, BIAS, SEPC, CV, and d were calculated for the pooled samples collected from the fertilization plots in 2014 and the Hulbert plots in 2015. All the models were built using the first three PLS factors.

