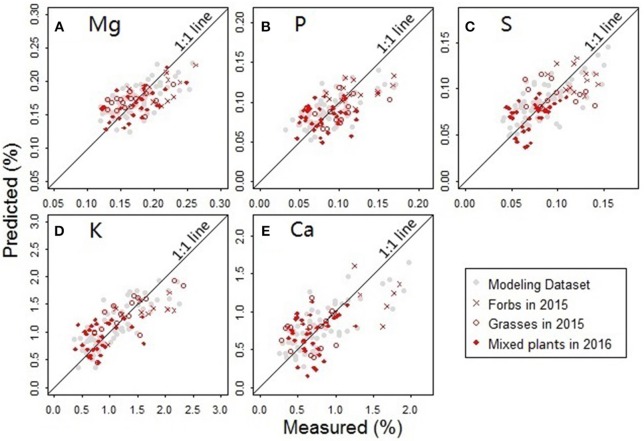
Figure 9.
Comparisons between the measured and predicted nutrient concentrations for the elements (A) Mg, (B) P, (C) S, (D) K, and (E) Ca. Samples used in the analysis included the forbs and grasses collected from the Hulbert plots in 2015 and the mixed plant types collected from the Belowground plots in 2016.

