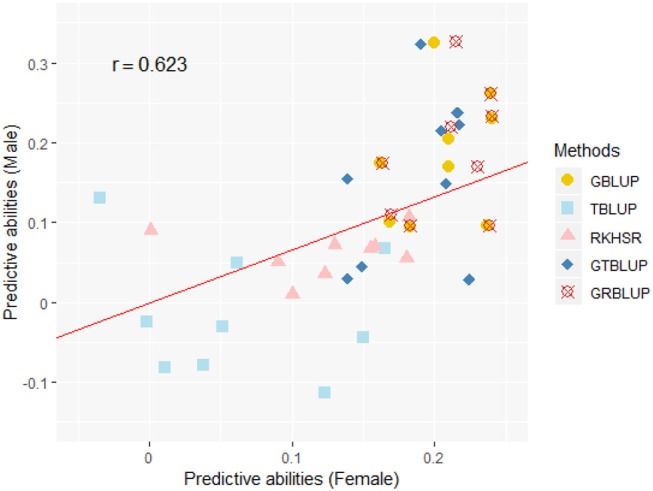
Figure 3.

The correlation between predictive abilities in females and males across nine traits and five statistical models. r denotes the Pearson correlation coefficient between female and male predictive abilities across all traits and all statistical models. The red line denotes a standardized major axis regression line.
