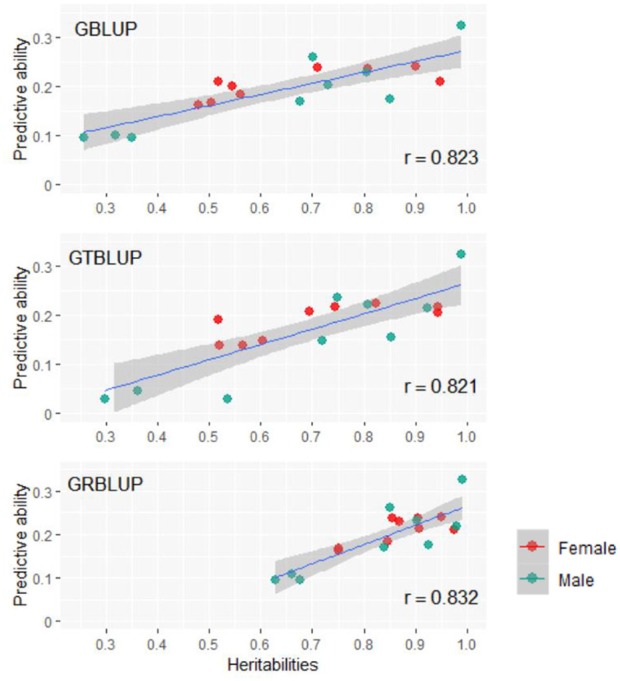
Figure 4.

The correlation between heritabilities , , and predictive abilities for GBLUP, GTBLUP, and GRBLUP across all traits and both sexes. r denotes the Pearson correlation coefficient. The blue lines denote the overall linear regression lines. The gray shadow denotes the 0.95 confidence interval.
