Figure 4.

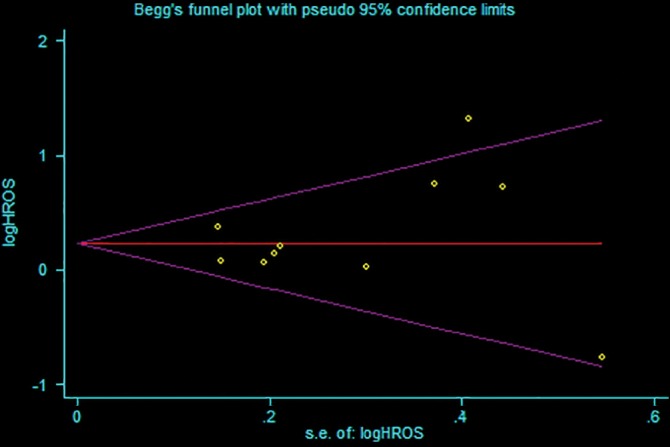
Funnel plot of the included studies for analysis of overall survival. Begg's test: P = 0.421; Egger's test: P = 0.490. HROS, hazard ratio of overall survival; SE, standard error.

Funnel plot of the included studies for analysis of overall survival. Begg's test: P = 0.421; Egger's test: P = 0.490. HROS, hazard ratio of overall survival; SE, standard error.