Abstract
Background
To investigate the gene expression profile of a set of candidate genes for a better understanding of the molecular mechanism underlying the pathogenesis of thymoma with or without myasthenia gravis.
Methods
Thymoma patients and thymoma patients with myasthenia gravis were analyzed using microarray profiling to identify significant changes in gene expression of autoimmune regulator pathway genes including AIRE, IL‐7R, CHRNA3, SYMD1, THRA, and CAV3.
Results
Across all of our samples, we found that 1484 mRNAs were upregulated and 770 were downregulated in thymoma patients compared with thymoma with myasthenia gravis patients. Gene ontology and pathway analysis revealed that a large number of genes participated in cellular functions for humoral immune response, sequence‐specific DNA binding RNA polymerase II transcription factor activity, positive regulation of gene expression, regulation of neuron projection development, extracellular ligand‐gated ion channel activity, positive regulation of striated muscle cell differentiation, and regulation of nuclear factor‐kappaB import into the nucleus.
Conclusion
Our results revealed genetic differences between thymomas and myasthenia gravis, and identified the key candidate genes/pathways for molecular mechanism.
Keywords: Analysis, gene ontology, microarray, myasthenia gravis, pathway, thymoma
Introduction
Thymoma is a mediastinal tumor originating from the thymus epithelial cells and accounting for approximately 25% of mediastinal tumors.1 Approximately 30% of patients with thymoma also have myasthenia gravis (MG).2 Recently, studies have suggested that thymoma with autoimmune disorders is likely mediated by the dysfunction in central tolerance and immunoregulation.3 However, the precise mechanisms underlying the process of thymoma‐related disorders have not been clarified. Therefore, further understanding the molecular mechanisms undergoing the immune dysfunction will be of great significance in the management of patients with thymoma in the clinic.
It is well understood that antibodies against the acetylcholinereceptor (AchR) are essential for the development of MG, and that anti‐AchR can block the post‐synaptic membrane, AchR, as well as reduce the quantity of AchR at the neuromuscular junction, leading to a decrease in the responses to neurotransmitter Ach at muscular contractions.
Present studies have investigated whether different subunits of AchR are expressed in the thymus during the process in humans, and if some subunits of AchR expression are associated with the development of thymoma‐related MG.4, 5 In our previous study, we found that significantly lower levels of autoimmune regulator (AIRE) and AchR expression are associated with the development of thymoma‐related MG.6 With rapid development of “‐omic” technologies, whole genome expression analysis and next‐generation sequencing have provided new insights into elucidating the complexity and profiles of genomic alterations of thymoma‐related MG.
The objective of the present study was to elucidate the molecular mechanism underlying pathogenesis of thymoma‐related MG by molecular gene expression profiling. In the present study, the gene expression profiles of thymoma with a panel of six genes comprising nuclear factor (NF)‐kappaB/AIRE pathway‐related immunoregulation genes were compared with those of simple thymomas to analyze efficiency in vitro and by real‐time polymerase chain reaction (RT–PCR). The results of the present study strengthen our understanding of the molecular mechanisms underlying thymoma‐related MG.
Methods
Ethics
The Research Ethics Committee of the Second Hospital of Tianjin Medical University approved this study (IRB No. KY2018K055). All procedures performed in studies involving human participants were in accordance with the ethical standards of the institutional and/or national research committee and with the 1964 Helsinki declaration and its later amendments or comparable ethical standards. Written informed consent was provided by all patients before the treatment procedure was started.
Clinicopathological features of patients
A total 20 patients with thymoma were recruited at the inpatient service of the Department of Cardiothoracic Surgery in The Second Hospital of Tianjin Medical University. All patients were subjected to surgical resection of the thymoma. There were eight patients with simple thymoma without other relative clinical diseases (the Tm group), and 12 patients with thymoma and MG (the MG group; Table 1).
Table 1.
Thymoma types of patients enrolled in the present study
| Tm | MG | Total | |
|---|---|---|---|
| Thymoma type A | 2 | 5 | 7 |
| Thymoma type AB | 2 | 3 | 5 |
| Thymoma type B1 | 2 | 2 | 4 |
| Thymoma type B2 | 2 | 2 | 4 |
| Total | 8 | 12 | 20 |
MG, thymoma patients with myasthenia gravis; Tm, thymoma patients.
Inclusion criteria were as follows: (i) patients diagnosed with thymoma according to the National Comprehensive Cancer Network (2016); (ii) patients aged 18–64 years; (iii) complicated with or without MG; and (iv) all the patients enrolled in the study were treated with thymus mass resection under thoracoscopic or through median sternotomy incision by general anesthesia. Exclusion criteria were as follows: (i) hypertension, diabetes, coronary heart disease, and other chronic diseases; and (ii) complicated with other autoimmune diseases, such as systemic lupus erythematosus, scleroderma, pemphigus, and pemphigoid. This experiment enrolled 20 patients, nine of whom were men (mean age 41.3 ± 8.34 years) and 11 were women (mean age 51.6 ± 7.98 years). Among these patients, eight were thymoma (Tm) and 12 were thymoma complicated with MG (MG).
Microarray analysis
This experiment enrolled eight patients: four patients with simple thymoma without other relative clinical diseases (the Tm group), and four patients with thymoma and MG (the MG group; Table 1). Total RNA was isolated using Trizol Reagent (Life Technologies, Grand island, NY, USA) according to the manufacturer's instructions. RNA was assessed for quality control utilizing the Agilent Bioanalyzer 2100 (Agilent Technologies, Santa Clara, CA, USA), and then purified using the RNeasy mini kit and RNase‐Free DNase Set (QIAGEN, Hilden, Germany), according to the manufacturer's protocols. mRNA was amplified and labeled with the Agilent Low Input Quick Amp Labeling Kit, one‐color and full genome chip (4 × 44K, design ID: 014850; Agilent Technologies) according to the manufacturer's protocols. The RNeasy mini kit was used to purify and conjugate the cRNA. Gene chips were hybridized for 17 hours in a hybridization oven at temperature <65°C and 1.00 g using the Agilent's Gene Expression Hybridization Kit with a sample quantity of 1.65 μg cRNA according to the manufacturer's instructions, and then screened using Agilent Microarray Screener. Slides were washed in staining dishes (Thermo Shandon, Pittsburgh, PA, USA) with Gene Expression Wash Buffer Kit. The software was set to the green dye channel, 5 μm of scan resolution, and 100%, 10%, and 16 bit of PMT. Data were captured by Feature Extraction software v.10.7 and Gene Spring Software v.11.0, uniformly treated with a quantile algorithm, and analyzed using an online analysis system (SAS; Shanghai Bohao Company, Shanghai, China). Fold changes ≥2 (upregulated) or ≤0.5 (downregulated) were used as the cut‐off to screen differentially expressed genes (DEGs).
Gene ontology and pathway analysis
Genes and gene products were characterized using Gene ontology (GO) analysis in terms of cellular components, molecular functions, and biological processes. Pathway analysis is an effective approach to predict the underlying biological functions of differentially expressed genes, and widely used to identify major pathways in which differentially expressed mRNAs distribute. The P‐value was calibrated with a false discovery rate (P < 0.05) to determine the significance of GO term enrichment.
RT–PCR
To validate the microarray data, we selected 20 patients for RT–PCR. Total RNA was isolated from thymoma and thymic cyst tissue using TRIzol Reagent (Goldenbridge Biotech, Beijing, China), according to the manufacturer's instructions. The cDNA was digested with DNase 1, and then synthesized by reverse transcription from RNA samples using oligo (dT) primers (Takara, Beijing, China) and TransScript RT/RI/Enzyme Mix (Takara). Quantitative RT–PCR (qRT–PCR) was used to determine the relative mRNA transcription levels of AIRE, IL‐7R, CHRNA3, SYMD1, THRA, and CAV3 to the control glyceraldehyde 3‐phosphate dehydrogenase with SYBR green PCR master mix buffer (Takara) and specific primers. As shown in Table 2, qRT–PCR primers were designed and synthesized by Sangon Biotech Company (Shanghai, China). The PCR amplification was carried out as follows: pre‐denaturation at 94°C for 3 minutes, followed by 35 cycles of 94°C for 30 seconds, 56–58°C for 30 seconds, and 72°C for 1 minute, and finally extension at 72°C for 5 minutes. The relative expression levels of targeted genes were normalized to the control glyceraldehyde 3‐phosphate dehydrogenase and analyzed by 2−ΔΔCt.
Table 2.
Primers for quantitative real‐time polymerase chain reaction
| Gene | Forward | Reverse |
|---|---|---|
| AIRE | ACCGGGTTTTCTTCCCAATA | AGAGACGCCCATGCAGACT |
| IL‐7R | TCGTCCACGGGTCCTCTCTCCC | GTACAGTTTTGTAAACGATGG |
| CHRNA3 | TGTTGATGCTGTGCTGTCCC | GCCATCAGGGGTTGCAGAAA |
| SMYD1 | CACAGACCCAGCAGTTCA | GGGCATTGTTATGGTGGT |
| THRA | TCGAGCACTACGTCACCAC | CCCCCTTGTACAGAATCGAA |
| CAV3 | AACTCAGCCCACCCAGTATCT | GTTGGGTCAGAAGACAAACCA |
| GAPDH | ACCGAGCGCGGCTACAG | CTTAATGTCACGCACGATTTCC |
Statistical analysis
The statistical software SPSS 19.0 (IBM Corp., Armonk, NY, USA) was used for data analysis where t‐test of independent samples was used for continuous variables. The significance level and misjudgment rate of each GO terms were estimated by Fisher's exact test and the χ2‐test. All data are expressed as the mean ± SD of each group of patients, and we used an alpha of P < 0.05 to determine statistical significance.
Results
mRNA profiles differ between patients with thymoma and controls
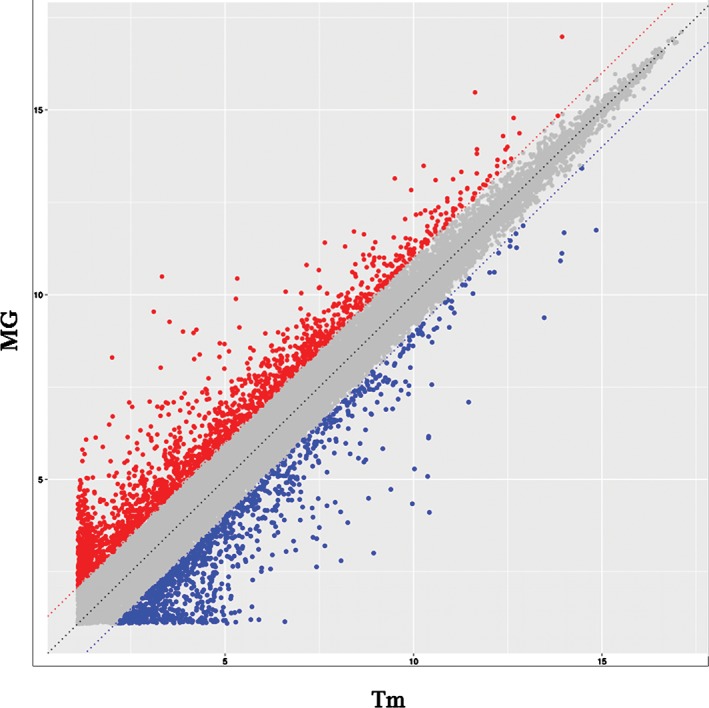
Agilent Whole Human Genome Microarray was used to detect mRNA from four Tm patients and four MG patients. A scatter plot of all the genes measured revealed notable differences in mRNA levels in many genes between the two groups (Fig 1). As shown in Figure 1, with a 2‐/0.5‐fold change as the cut‐off, we observed changes in 2254 mRNAs, including 1484 upregulated and 770 downregulated mRNAs, respectively, in Tm patients compared with MG patients.
Figure 1.

mRNA profile comparisons between thymoma patients (Tm) and thymoma‐related myasthenia gravis (MG). The vertical lines correspond to twofold upregulation or downregulation, and the horizontal lines represent P = 0.05. The red points highlight the upregulated genes, and the blue points reflect the downregulated genes.
GO and pathway analysis
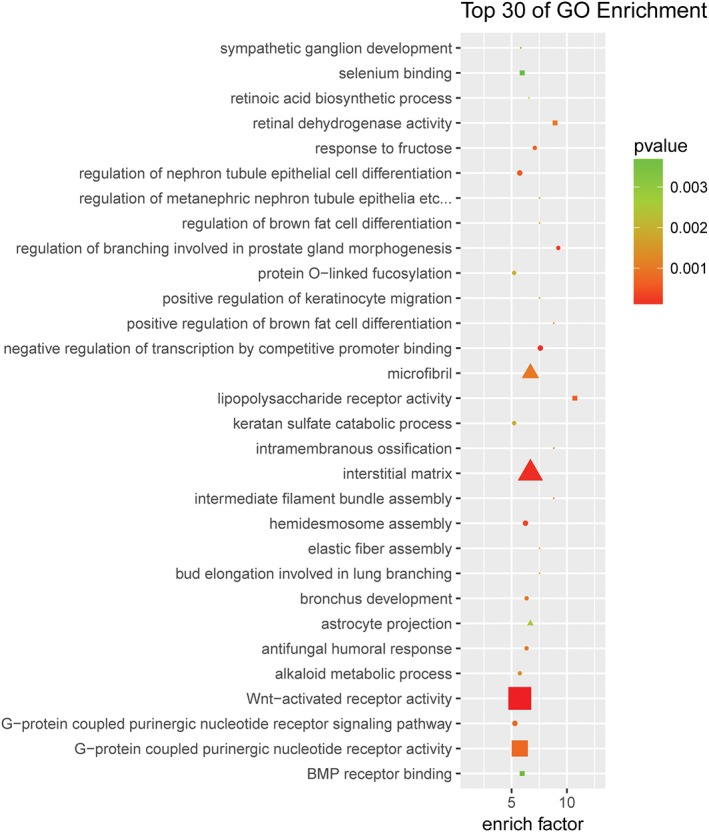
We probed significantly altered mRNAs from our microarray studies for the NF‐kappaB/AIRE pathway‐related immunoregulation genes to evaluate the enrichment of biological processes, cellular components, and molecular functions. We observed that dysregulated mRNAs were involved in cellular functions of humoral immune response, sequence‐specific DNA binding RNA polymerase II transcription factor activity, positive regulation of gene expression, regulation of neuron projection development, regulation of T‐cell differentiation in thymus, and T‐cell mediated cytotoxicity. Furthermore, a large number of genes participated in a variety of cellular functions (Fig 2). In particular, SMYD1, THRA, and CAV3 contribute to the process of MG by regulation of myotube differentiation (enrichment factor = 4.87). In addition, AIRE, IL‐7R, and CHRNA3 worked on the humoral immune response (enrichment factor = 2.2).
Figure 2.

Gene ontology (GO) enrichment from differentially expressed genes. The top 30 GOs that were dysregulated in thymoma patients compared with controls. Differentially expressed mRNAs were selected for GO analysis. The enrichment factor represents the enrichment of these mRNAs, and the P‐value shows a positive correlation with GO. GO_domain:  biological_process,
  cellular_component,
  molecular_function; diff_gene_count:
  4,
4,  5,
5,  6,
6,  7,
7,  8,
8,  9.
9.
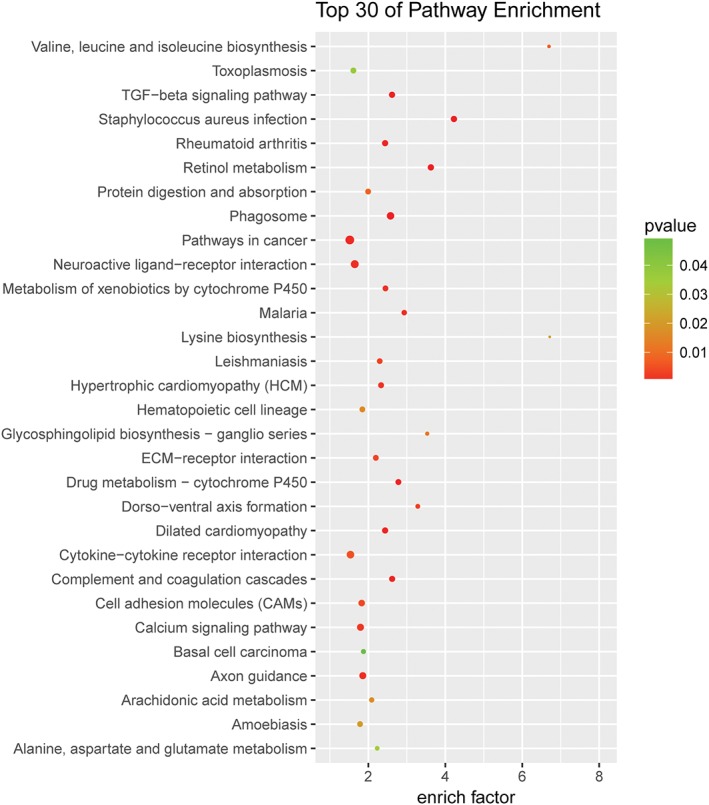
To better understand the potential underlying mechanisms in thymoma‐related MG, we performed pathway analyses for upregulated mRNAs with an absolute fold‐change ≥2, and identified pathways known to be important in thymoma‐related MG. As shown in Figure 3, the aberrantly upregulated mRNAs were mainly involved in the transforming growth factor‐beta signaling pathway, neuroactive ligand‐receptor interaction, cytokine‐cytokine receptor reaction, and calcium signaling pathway.
Figure 3.

Pathway analysis enrichment from differentially expressed genes. The top 30 pathways that were dysregulated in the thymoma patients group compared with the thymoma‐related myasthenia gravis patients group. Differentially expressed mRNAs were selected for pathway analyses. The enrichment factor represents the enrichment of these mRNAs, and the P‐value has a positive correlation with pathway. diff_gene_count:  10,
10,  20,
20,  30,
30,  40,
40,  50.
50.
qRT–PCR validation
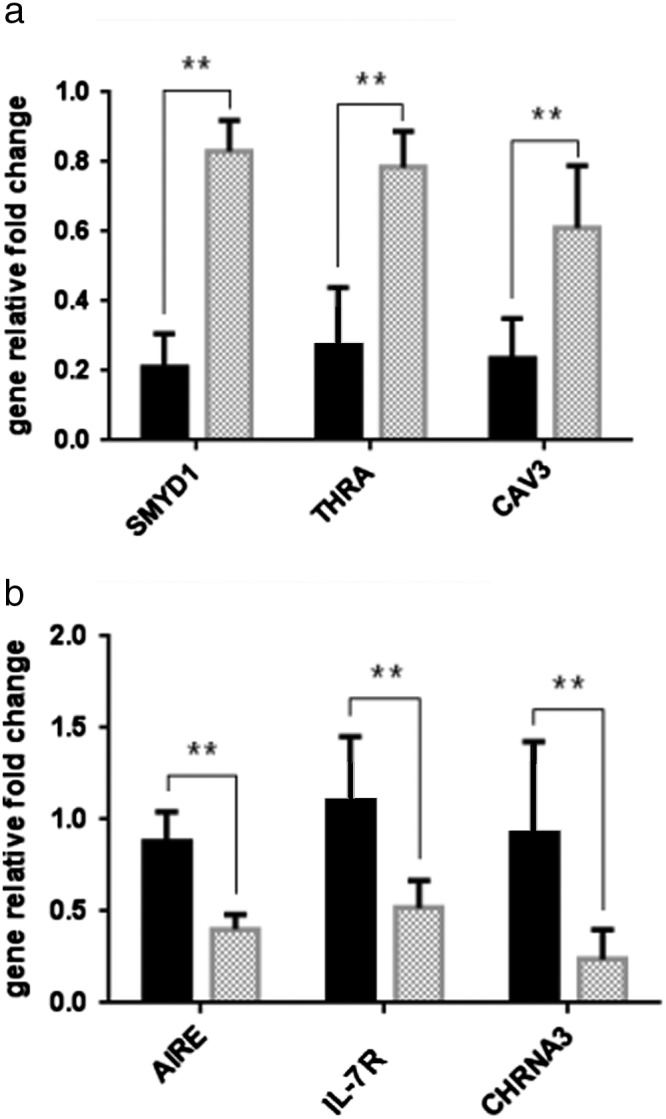
To independently validate gene expression changes in MG, six significantly dysregulated mRNAs involved in the NF‐kappaB/AIRE pathway were selected from 1484 upregulated mRNAs and 770 downregulated mRNAs in Tm patients for comparison with MG patients (Fig 4). Consistent with our microarray analyses, the expression levels of these six mRNAs in Tm were significantly different from MG, among which, SMYD1, THRA, and CAV3 displayed 5.41‐, 2.25‐, and 2.75‐fold higher expression, respectively. AIRE was validated (2.1‐fold lower expression), followed by IL‐7R (2.76‐fold lower expression), and CHRNA3 (6.59‐fold lower expression). These genes essentially contribute to the development of MG by regulation of the humoral immune response and myotube differentiation (enrichment factor >2). The results were consistent with those of the microarray chip analyses.
Figure 4.

Validation of mRNA microarray data by quantitative real‐time polymerase chain reaction. The relative expression level of each mRNA, (a) upregulated mRNAs and (b) downregulated mRNAs, was normalized to glyceraldehyde 3‐phosphate dehydrogenase and expressed as the mean ± SD. **P < 0.01. MG, thymoma‐related myasthenia gravis patients group; TM, thymoma patients group.  Tm Group;
  MG Group;
  Tm Group;
  MG Group.
Discussion
In the present study, we conducted microarray analysis to investigate differential expression profiles of human mRNAs in patients with thymoma, presenting a comprehensive gene expression profile of thymoma‐related MG. In the present study, microarray was used to assess differential key gene expression related to the NF‐kappaB/AIRE pathway and craft a pathway signature of thymoma using GO enrichment analysis.
Thymoma is associated with the development of MG.7 AchR is an important autoantigen involved in the pathogenesis of MG, and anti‐AchR has been shown to participate in the pathogenic process of MG. In our previous study, we found that the relative levels of AchR expression in thymomas from patients with thymoma and MG were significantly lower than that in patients with simple thymomas, but significantly higher than that in thymoma patients with MG and one other autoimmune disease. Interestingly, the relative levels of AchR expression were correlated positively with the levels of AIRE expression in thymomas.6 In the present study, we identified a total of 2254 differentially expressed mRNAs (1484 upregulated and 770 downregulated mRNAs) between four thymoma‐related MG patients and four thymomas. It is consistent with our finding of a relationship between AchR and AIRE expression in thymoma‐related MG. Among them, AIRE and IL‐7R, acting as immune regulators, as well as CHRNA3 (subunit of AchR), were significantly downregulated in thymoma‐related MG and repressed by an epigenetics mechanism.8
Nevertheless, the precise mechanisms underlying the deficiency of AIRE in thymoma‐related MG have not been clarified. SET and MYND domain‐containing protein 1 (SMYD1) is a type of histone methyltransferase. Recent studies have shown that SMYD1 is extensively expressed and participates in various cellular processes.9 However, the expression of SMYD1 in thymoma has rarely been reported. Interestingly, the relative levels of SMYD1 expression were correlated with the levels of AIRE expression in thymomas. It is possible that the relative lower levels of AIRE expression might be secondary to increased levels of SMYD1 expression in thymoma‐related MG. Dysregulation of THRA in autoimmune disease is reported to correlate with novel molecular mechanisms, uncovering molecular actions in the cell differentiation and development.10 Our GO analysis suggests that relatively higher levels of SMYD1, THRA, and CAV3 expression may contribute to the development of MG by regulation of myotube differentiation. Therefore, our findings may provide new insights into the pathogenesis of MG.
Compared with thymomas, the thymoma‐related MG patients differentially expressed 2254 mRNAs. A majority of the identified genes were classified into “humoral immune response”, followed by “sequence‐specific DNA binding RNA polymerase II transcription factor activity”, “regulation of neuron projection development”, and “regulation of T‐cell differentiation in thymus” and “T‐cell mediated cytotoxicity” (Fig 3). Significantly different expression levels of the mRNAs may be associated with the mechanisms of thymoma‐related MG.
In conclusion, we successfully identified novel genetic alterations for molecular understanding of the occurrence and development of thymoma‐related MG. The genetic differences of a set of genes between thymomas and thymoma‐related MGs will be helpful to identify the key or candidate gene/pathway responsible for thymoma‐related MG. Therefore, we recommend that future research should be directed towards better understanding of the relationship between the key gene and MG, and the mechanism and role of the NF‐kappaB/AIRE pathway in MG occurrence and development.
Disclosure
No authors report any conflict of interest.
Acknowledgment
This work was supported by the National Natural Science Foundation of China (No. 81601411).
Contributor Information
Zhi‐Yu Guan, Email: guanzy69@163.com.
Fan‐Jie Meng, Email: mengfanjie2y@hotmail.com.
References
- 1. Travis WD, Brambilla E. In: Burke AP, Marx A, Nicholson AG. (eds). WHO Classification of Tumours of the Lung, Pleura, Thymus and Heart. IARC Press, Lyon: 2015. [DOI] [PubMed] [Google Scholar]
- 2. Thongprayoon C, Tantrachoti P, Phatharacharukul P, Buranapraditkun S, Klaewsongkram J. Associated immunological disorders and cellular immunedysfunction in thymoma: A study of 87 cases from Thailand. Arch ImmunolTher Exp (Warsz) 2013; 61: 85–93. [DOI] [PubMed] [Google Scholar]
- 3. Shelly S, Agmon‐Levin N, Altman A, Shoenfeld Y. Thymoma and autoimmunity. Cell Mol Immunol 2011; 8: 199–202. [DOI] [PMC free article] [PubMed] [Google Scholar]
- 4. Luo J, Lindstrom J. Myasthenogenicity of the main immunogenic regionand endogenous muscle nicotinic acetylcholine receptors. Autoimmunity 2012; 45: 245–52. [DOI] [PMC free article] [PubMed] [Google Scholar]
- 5. Alberobello AT, Wang Y, Beerkens FJ et al PI3K as a potential therapeutic target in Thymic epithelial tumors. J Thorac Oncol 2016; 11: 1345–56. [DOI] [PMC free article] [PubMed] [Google Scholar]
- 6. Liu Y, Zhang H, Zhang P, Meng F et al Autoimmune regulator expression in thymomas with or withoutautoimmune disease. Immunol Lett 2014; 161: 50–6. [DOI] [PubMed] [Google Scholar]
- 7. Lu Y, Meng F et al Significance of B10 cell in patients with thymoma complicated with myasthenia gravis. Oncotarget 2017; 8 (43): 73774–86. [DOI] [PMC free article] [PubMed] [Google Scholar] [Retracted]
- 8. Bansal K, Yoshida H, Benoist C, Mathis D. The transcriptional regulator Aire binds to and activates super‐enhancers. Nat Immunol 2017; 18: 263–73. [DOI] [PMC free article] [PubMed] [Google Scholar]
- 9. Du H, Cline MS, Osborne RJ, Tuttle DL et al Aberrant alternative splicing and extracellular matrix gene expression in mouse models of myotonic dystrophy. Nat Struct Mol Biol 2010; 17 (2): 187–93. [DOI] [PMC free article] [PubMed] [Google Scholar]
- 10. Park S, Han CR, Park JW et al Defective erythropoiesis caused by mutations of the thyroid hormone receptor α gene. PLoS Genet 2017; 13 (9): e1006991. 10.1371/journal.pgen.1006991. [DOI] [PMC free article] [PubMed] [Google Scholar]


