
Figure 1.
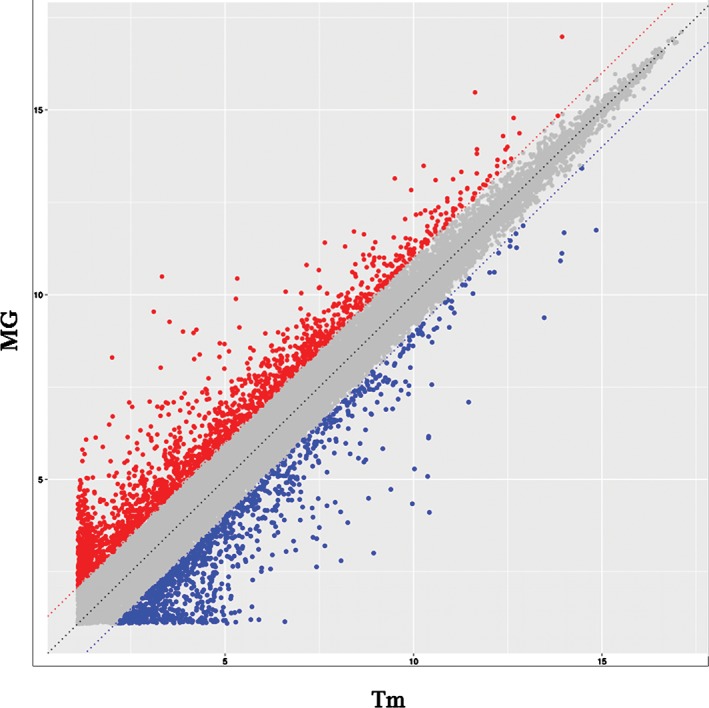
mRNA profile comparisons between thymoma patients (Tm) and thymoma‐related myasthenia gravis (MG). The vertical lines correspond to twofold upregulation or downregulation, and the horizontal lines represent P = 0.05. The red points highlight the upregulated genes, and the blue points reflect the downregulated genes.