
Figure 3.
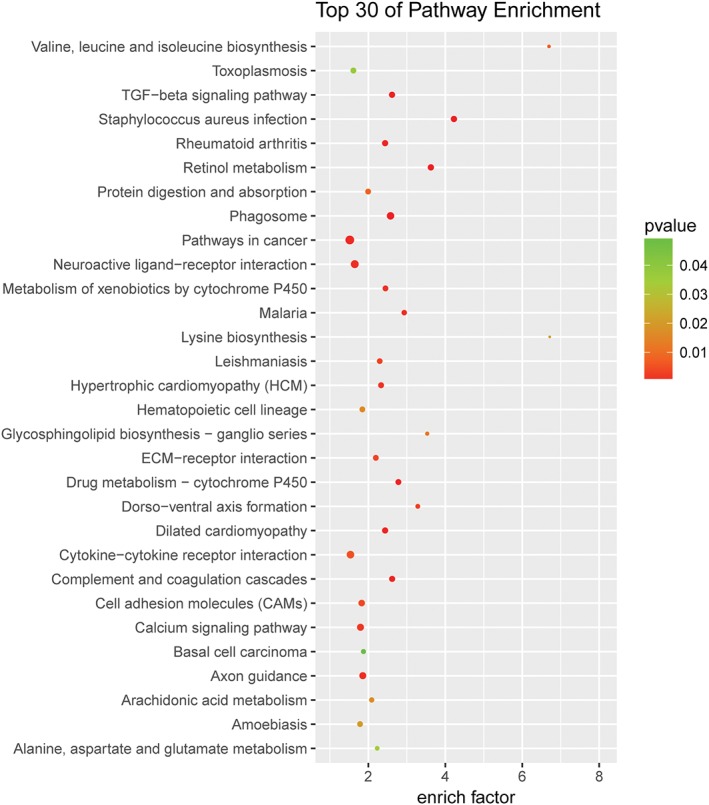
Pathway analysis enrichment from differentially expressed genes. The top 30 pathways that were dysregulated in the thymoma patients group compared with the thymoma‐related myasthenia gravis patients group. Differentially expressed mRNAs were selected for pathway analyses. The enrichment factor represents the enrichment of these mRNAs, and the P‐value has a positive correlation with pathway. diff_gene_count:  10,
10,  20,
20,  30,
30,  40,
40,  50.
50.