Figure 3.
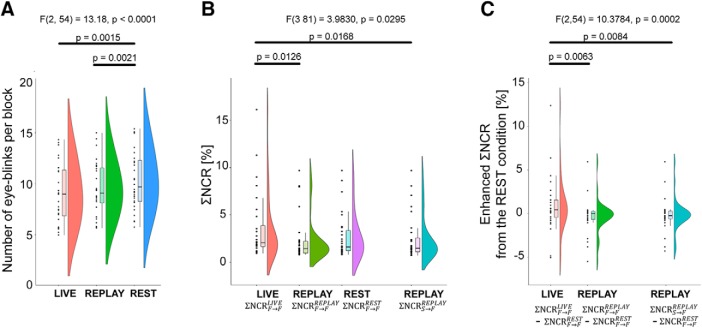
Behavioral analysis. A, The number of eye-blinks per block. We omitted the first 5 s of each block because of instability of the recorded video induced by task switching; the number of eye-blinks was therefore calculated based on the succeeding 15 s. Each dot represents a data point. In the boxplot, the line dividing the box represents the median of the data, the ends represent the upper/lower quartiles, and the extreme lines represent the highest and lowest values excluding outliers. B, ΣNCR values. The integral of the NCR of each condition across the whole frequency range was calculated. is the ΣNCR from the time series of the participant’s facial movement to that of the partner during the LIVE condition. is the ΣNCR from the time series of the participant’s facial movement to that of the partner during the REPLAY condition. is the ΣNCR from the time series of the participant’s facial movement to that of the partner during the REST condition. is the ΣNCR from the time series from the participant’s delayed facial movement on the screen to the partner’s time series during the REPLAY condition. C, Enhanced ΣNCR values from the REST condition.

