Figure 3.
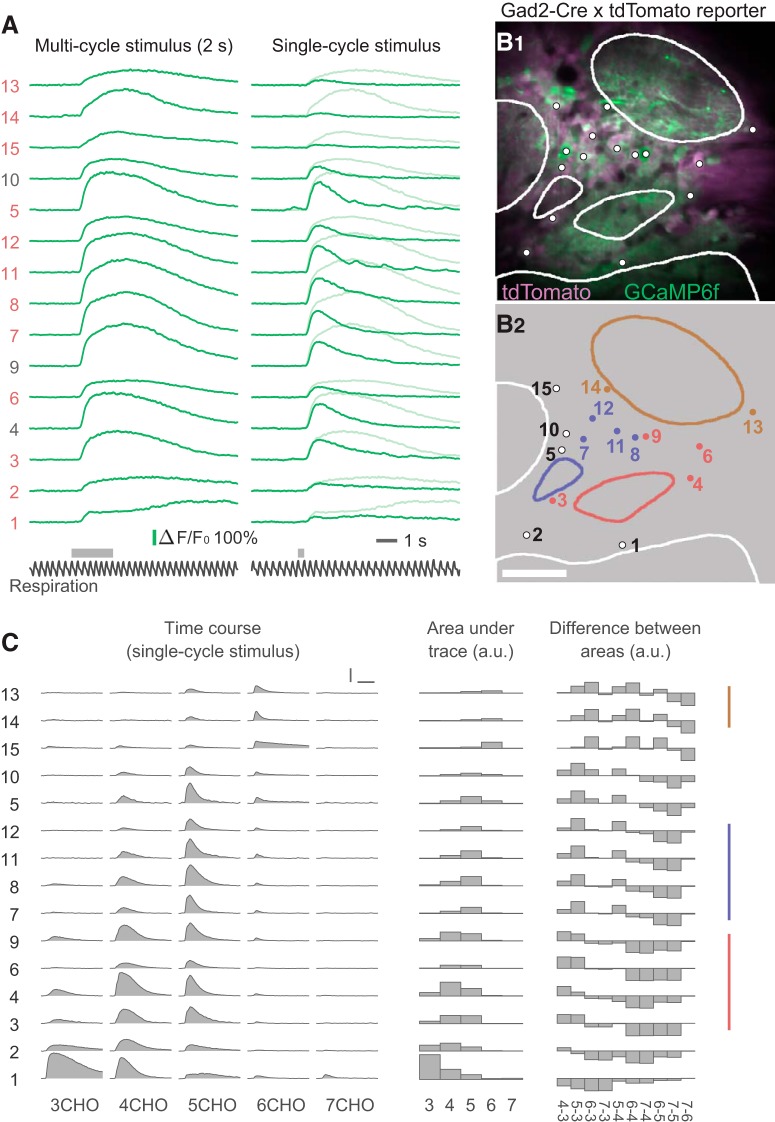
Odor-evoked calcium transients and grouping of JG cells by response profile. A, An example dataset from a single trial of random-access scanning of 15 ROIs (cells). Left traces are responses to a 2 s odor stimulus, and right traces are responses to a single-respiration-cycle stimulus. The bottom black traces show the respiration signal. Gray horizontal bars above the respiration signals indicate the timing of valve opening for odor presentation. Note that actual odor presentation lags ∼0.1 s behind the valve opening. The ordering of the ROIs is intentional, based on the result of grouping shown in C. B, Two-photon image of the recording site (B1) and the ROI indexes (B2). To obtain the two-photon image of GCaMP6f (green), all XYT imaging data for all odors were averaged and then all poststimulus frames were averaged, solely for making the GCaMP fluorescence more visible. The tdTomato image (magenta) was obtained with a similar procedure, but an average of prestimulus frames was used. Dots and contours represent the ROIs and glomeruli, respectively. Non-white colors of dots and contours in B2 indicate the groups presented in C. Scale bar, 50 μm. C, Odor-evoked responses of the same ROIs to five odors (single-cycle stimulus). The left block shows the response time courses. The middle block shows the areas under the time courses as bar charts. The right block shows the difference in areas between every possible pair of odors. Colored vertical lines at the right indicate the groups of cells putatively associated with the same glomerulus (see text for details). Scale bars: horizontal, 3 s; vertical, 100% ΔF/F0.

