Figure 5.
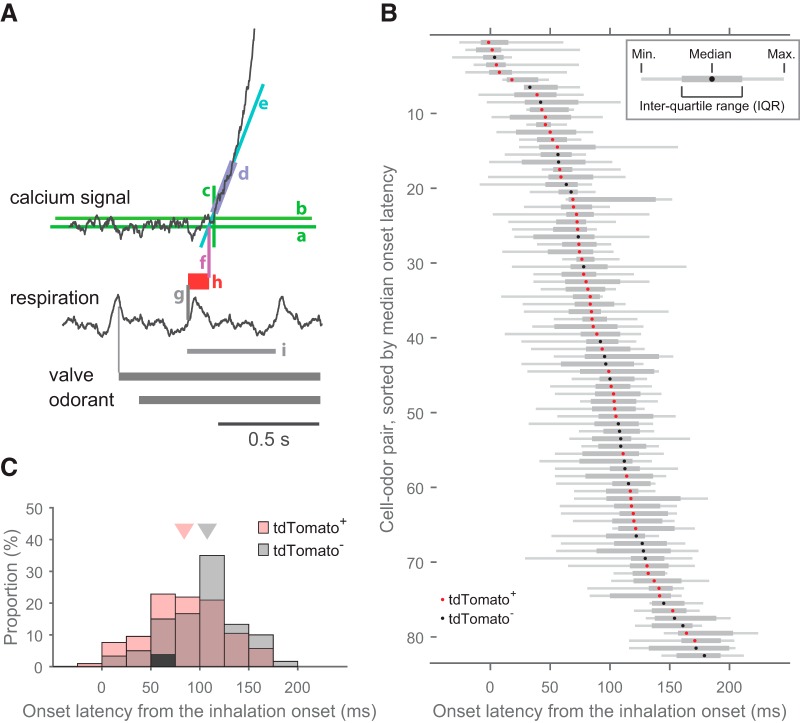
Onset latencies of odor-evoked calcium transients are heterogeneous across JG cells. A, Graphic representation of the definition of onset latency. Aa, Baseline, defined as the mean of the prestimulus period signal. Ab, Threshold, defined as 2.5 times the SD of the prestimulus period signal. Ac, Time point at which the signal exceeds the threshold. Ad, Time window of the first 100 ms above the threshold. Ae, Regression line of the signal in the 100 ms time window. Af, The point where the regression line crosses the baseline. This time point is considered the onset of the calcium transient. Ag, Onset of the first inhalation with the odor stimulus. Ah, Onset latency, defined as the distance between the onset of inhalation and the onset of the calcium transient. Ai, One cycle of respiration. B, Distribution of onset latencies. Each row corresponds to a single cell–odor pair and the distribution of onset latencies across repetitions is presented as a box-and-whisker plot (inset). Dots in the box-and-whisker plots represent the median, and expression of the GAD2 marker tdTomato is indicated by the dot color (red, tdTomato+; black, tdTomato−). Cell–odor pairs are arranged according to median onset latency and every other pair is presented for clarity (83 cell–odor pairs from 8 recording sites, out of all 165 pairs, are presented). Each box-and-whisker plot represents data from 5–17 trials. C, Overlapping histograms showing the distribution of medians shown in B for tdTomato+ (red) and tdTomato− (gray) cell populations. Triangles in the top indicates median for each population (tdTomato+: 84 ms, 105 cell–odor pairs; tdTomato−: 108 ms, 60 cell–odor pairs; p = 0.012, Mann–Whitney U test).

