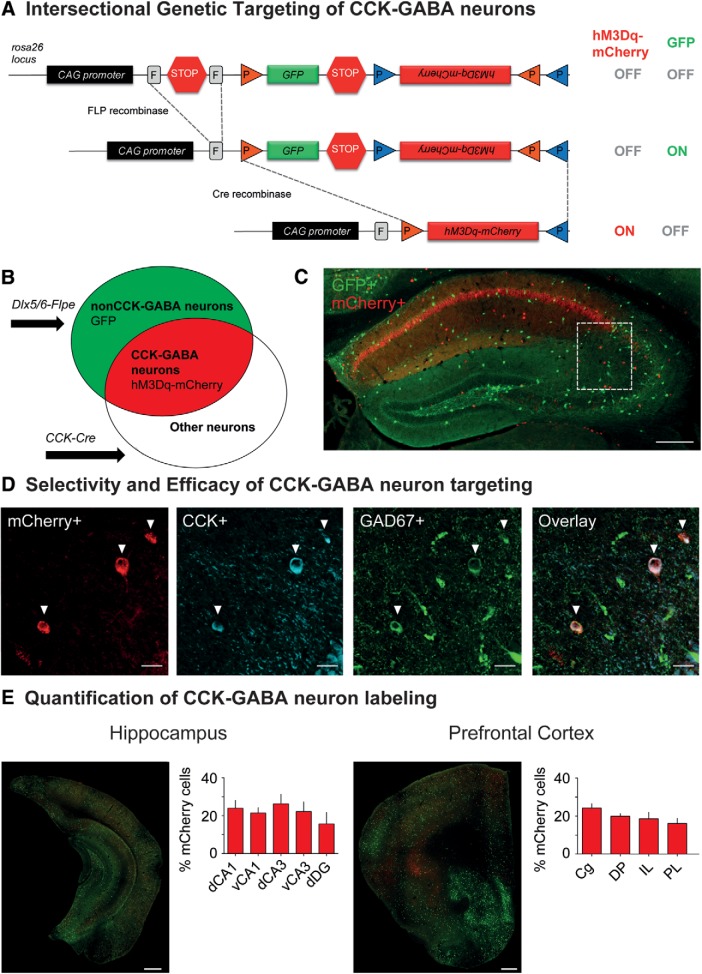
Figure 1.
Intersectional genetic approach for targeting hM3Dq receptors to CCK-GABA neurons. A, top, The dual recombinase-responsive RC::FL-hM3Dq allele is knocked-in to the Gt(ROSA)26Sor (R26) locus with CAG (chicken β-actin and CMV enhancer) promoter elements. Middle, Flpe-mediated excision of the FRT (rectangles, denoted by F)-flanked stop cassette (STOP) permits expression of GFP. Transcription of the mCherry-hM3Dq allele is prevented by the inverted orientation of the sequence and second stop cassette. Bottom, Subsequent Cre-mediated recombination of loxP (orange triangles) and lox2272 (blue triangles) sites constituting the Cre-dependent FLEX switch leads to the removal of the GFP sequences and second stop cassette as well as inversion of the hM3Dq-mCherry sequences into the proper orientation for transcription. Cells expressing Cre and Flpe therefore express hM3Dq-mCherry but not GFP. B, Venn diagrams illustrating intersectional and subtractive cell populations targeted using the intersectional genetic approach. The Dlx5/6-Flpe allele is specific to GABAergic cells in the forebrain, whereas the CCK-Cre allele is specific to Cre-expressing cells. In mice inheriting all three alleles (CCK-Cre;Dlx5/6-Flpe;RC::FL-hM3Dq), cells expressing both Cre and Flpe alleles (i.e., intersectional population) represent CCK-GABA neurons and express hM3Dq-mCherry. Cells expressing only the Flpe allele (i.e., subtractive population) represent nonCCK-GABA neurons and express only GFP. C, Low-magnification images showing hM3Dq-mCherry+ and GFP+ neurons in the dorsal hippocampus of CCK-GABA/hM3Dq+ mice. Scale bar = 250 µm. D, Confocal images of the CA1 SR in CCK-GABA/hM3Dq+ mice. mCherry+ cells are labeled in red, CCK+ cells are labeled in blue, and GAD67+ cells are labeled in green. Cells expressing all three markers (mCherry, CCK, and GAD67) represent likely CCK-GABA neurons. Scale bar = 25 µm. E, Quantification of hM3Dq-mCherry+ and GFP+ cells in the hippocampus (n = 4) and prefrontal cortex (n = 5) of CCK-GABA/hM3Dq+ mice. Shown is the percentage of hM3Dq-mCherry+ cells out of all labeled cells. Scale bar = 500 µm. dCA1 = dorsal CA1, vCA1 = ventral CA1, dCA3 = dorsal CA3, vCA3 = ventral CA3, dDG = dentate gyrus, Cg = cingulate, DP = dorsal peduncular cortex, IL = infralimbic cortex, PL = prelimbic cortex. All figures present data as mean ± SEM.

