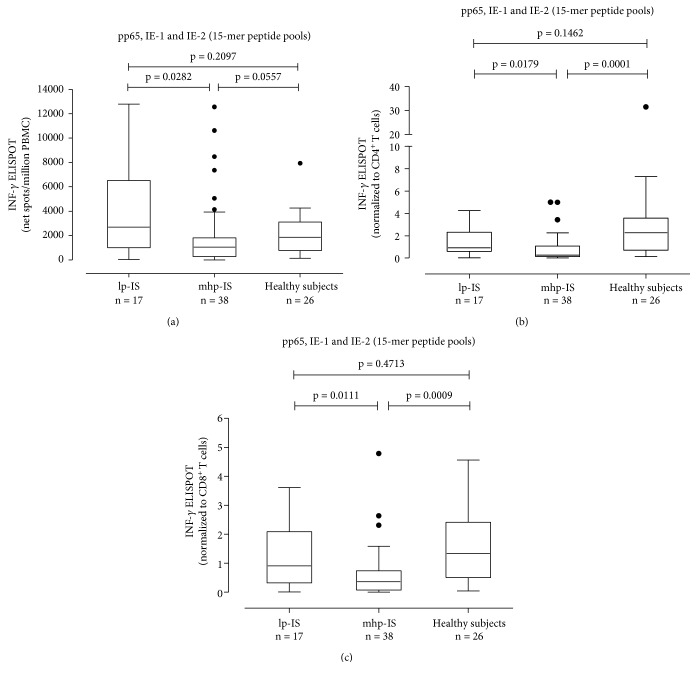
Figure 6.
HCMV-specific T cell response was measured in SLE patients receiving low immunosuppression (lp-IS, n = 17) and medium-high immunosuppression (mhp-IS, n = 38). Results were presented as net spots/million PBMCs (a) and normalized to CD4+ (b) and CD8+ (c) T cell responses. P values were calculated with the Mann-Whitney test.

