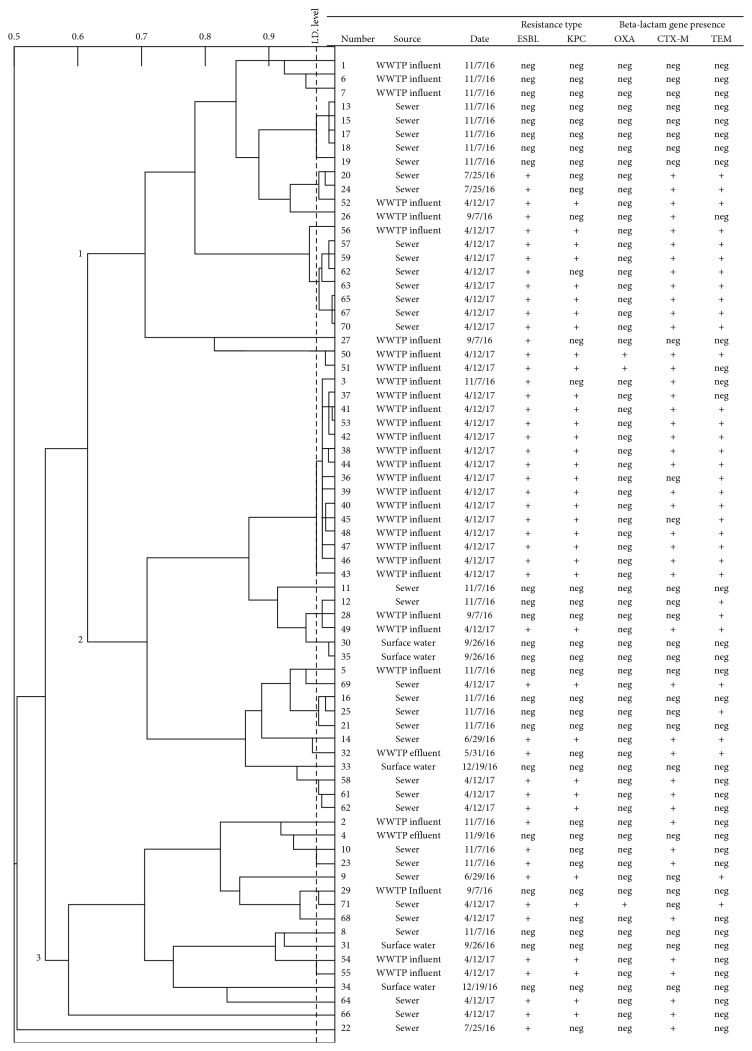
Figure 2.
Clonal relatedness of E. coli isolates (n=70) from environmental sources using a functional biochemical analysis and PCR verification of beta-lactam resistance gene presence. Identity “ID” levels are to the left of the dotted line, which represents a sensitivity of 0.975. Branches to the right of this line represent isolates that are too similar to distinguish. Bold numbers on branches (1, 2, 3) refer to three major clusters of isolates identifiable from the Pheneplate assay. Isolate numbers represent the unique identifiers assigned to each E. coli isolate throughout this study. WWTP = water treatment plant. Date = isolation date. ESBL = extended-spectrum beta-lactamase and KPC: Klebsiella pneumoniae carbapenamase. OXA, CTM-M, and TEM were the three beta-lactamase genes assessed with PCR, where “+”: gene present and “neg”: gene absent.

