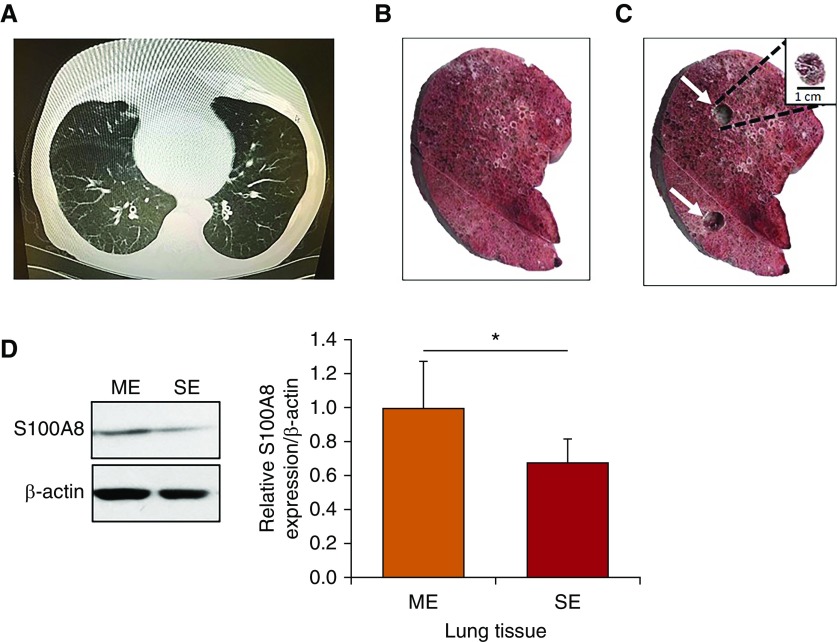
Figure 2.
Decreased S100A8 levels in lung tissue in severe emphysema. (A) Representative computed tomography scan of a patient with emphysema. The lung slice was obtained from a part of the lower and middle lobes. (B and C) Tissue cores were removed from areas with severe (upper white arrow) and mild (lower white arrow) emphysema from the same patient. A representative core is shown in the upper right corner. (D) Representative Western blot images of expression and quantification of S100A8 in mild and severe emphysema (n = 5). *P < 0.05. Data are shown as means ± SD. ME = mild emphysema; SE = severe emphysema.

