Figure 3.
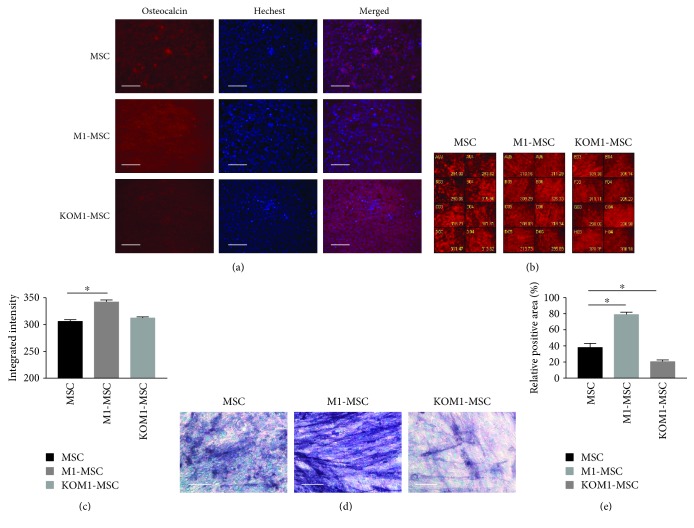
Osteogenic differentiation potencies of MSCs, M1-MSCs, and KOM1-MSCs. Osteogenic differentiation potencies of MSCs, M1-MSCs, and KOM1-MSCs were observed after 14 days of induction in osteogenic medium. Osteocalcin (red) was used as a marker of osteoblasts, and nuclei were stained with Hoechst (blue). (a) Typical images of MSCs, M1-MSCs, and KOM1-MSCs obtained by fluorescence microscopy (×200; scale bar: 50 μm). (b) Typical imaging screening panel for quantification of osteocalcin expression. Well number and average intensity are indicated on the image. (c) Osteocalcin expression in MSCs, M1-MSCs, and KOM1-MSCs. The average fluorescent intensity was obtained from 256 images for each group (∗P < 0.05). Results are expressed as mean ± SEM. (d) Typical images of alkaline phosphatase analysis (×400; scale bar: 25 μm). (e) Relative positive area of alkaline phosphatase staining. The purple-blue-stained area was segmented from the background, and the relative positive area was quantified. More than four fields per section and an average of five sections from each sample were used for semiquantitative analysis (∗P < 0.05). Results are expressed as mean ± SEM.

