Figure 4.
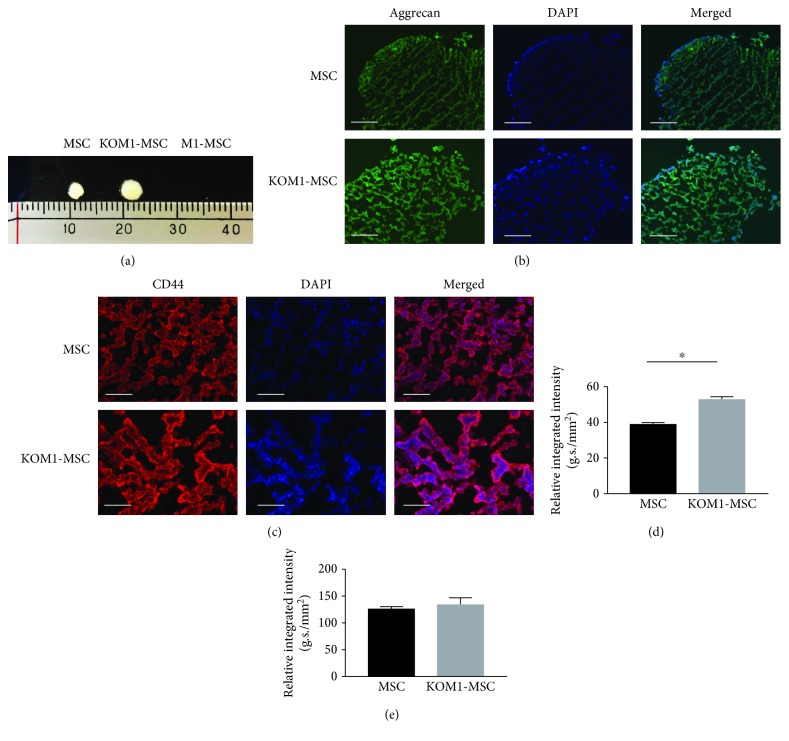
Chondrogenic differentiation potencies of MSCs, M1-MSCs, and KOM1-MSCs. (a) Micromass formation by MSCs, M1-MSCs, and KOM1-MSCs after 21 days of induction culture. M1-MSCs failed to form any micromasses. (b) Typical images of MSCs, M1-MSCs, and KOM1-MSCs obtained by fluorescence microscopy (×200; scale bar: 50 μm). Fixed chondrocyte pellets were embedded in OCT compound and sectioned on a cryotome. The sections were stained with an anti-human aggrecan antibody (green) and DAPI (blue). (c) Typical images of CD44 expression in MSCs and KOM1-MSCs. The sections were stained with an anti-human CD44 antibody (red) and DAPI (blue) (×400; scale bar: 25 μm). (d) Quantification of aggrecan expression in micromasses formed by MSCs, M1-MSCs, and KOM1-MSCs. More than four fields and average results of four sections for per sample were used for semiquantitative analysis. The integrated intensity was divided by the total area to determine the relative integrated intensity per mm2 (∗P < 0.05). Results are expressed as mean ± SEM. (e) Quantification of CD44 expression in the micromasses formed by MSCs and KOM1-MSCs. Results are expressed as mean ± SEM.

