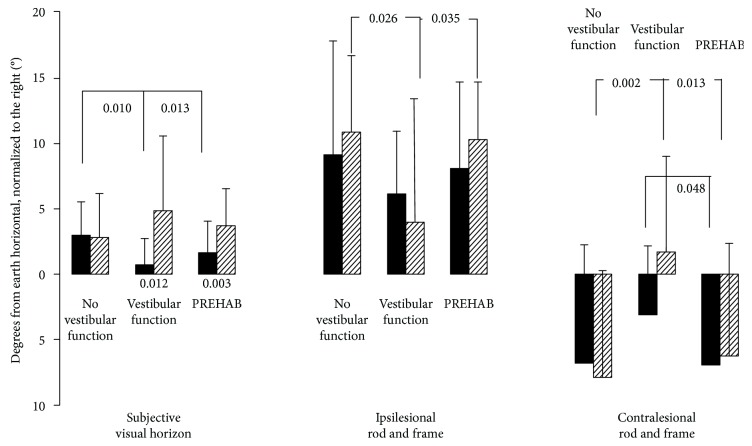
Figure 3.
Subjective visual horizon and rod and frame tests on the three groups before (black bars) and after surgery (striped bars). The values represent the mean and the error bars; standard error of mean (SEM). The Bonferroni corrected significant level for between-groups comparisons is set to p < 0.025 (in bold), but for consistency reasons p < 0.05 is also presented as trends (unbolded). The Bonferroni corrected significant level for within-subjects comparisons is set to p < 0.05.

