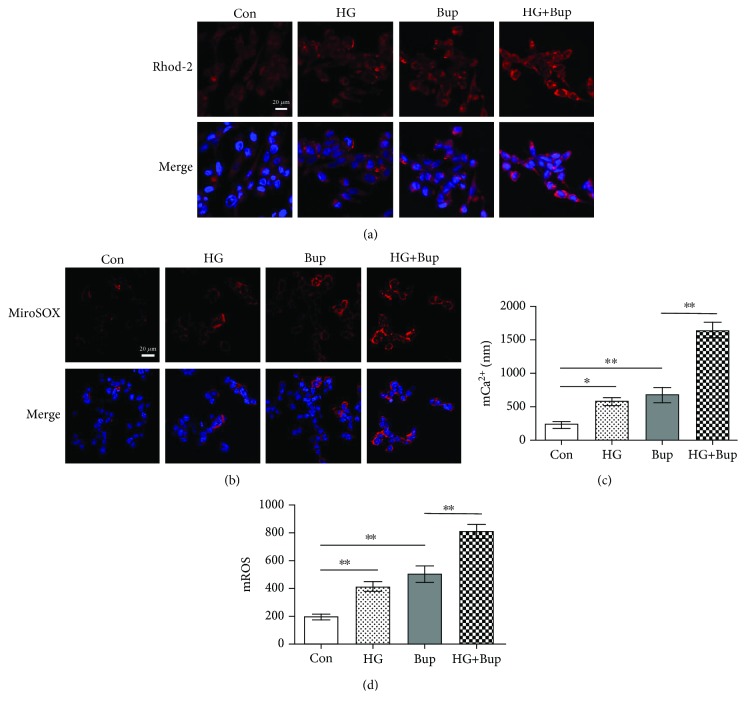
Figure 3.
High glucose enhanced bupivacaine-induced mCa2+ accumulation and mROS overproduction. Con: untreated cells; HG: cells treated with 25 mM glucose for 2 days; Bup: cells treated with 1.0 mM bupivacaine for 6 h; HG+Bup: cells cultured with 25 mM glucose for 2 days and treated with 1.0 mM bupivacaine for 6 h. (a) Mitochondrial Ca2+ was shown with the confocal scanning laser microscope. (b) Mitochondrial ROS was shown with the confocal scanning laser microscope. (c) Summarized data show mCa2+ measured with flow cytometry. (d) Summarized data show mROS measured with flow cytometry. Values are the mean ± SD (n = 3); ∗P < 0.05, ∗∗P < 0.01.

