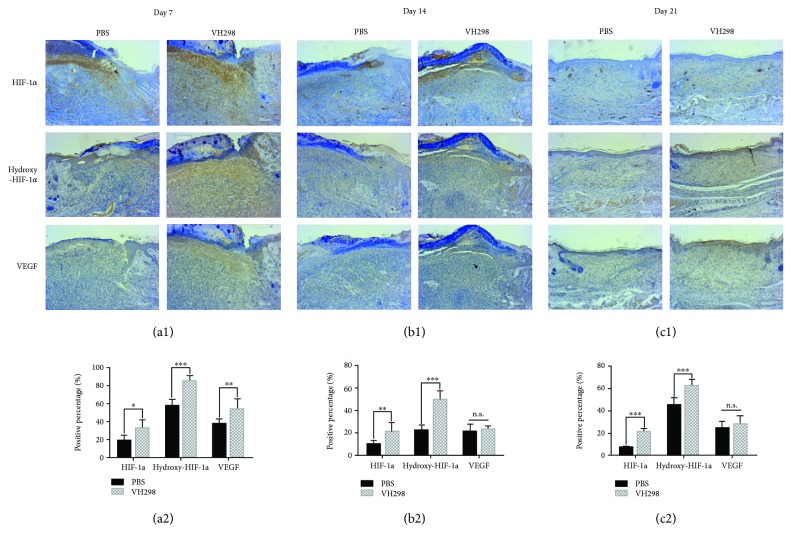
Figure 6.
Immunohistochemical analysis reflecting the activation of the HIF signalling pathway following VH298 treatment. (a1–c1) VH298 treatment significantly enlarged HIF-1α-, hydroxy-HIF-1α-, and VEGF-A-positive areas (brown) compared to PBS treatment. (a2–c2) Values expressed as the positive percentage of each group. Graphs represent mean ± SD (VH298-treated vs. PBS-treated) (n = 8). ∗P < 0.05 and ∗∗P < 0.01. n.s.: not significant.

