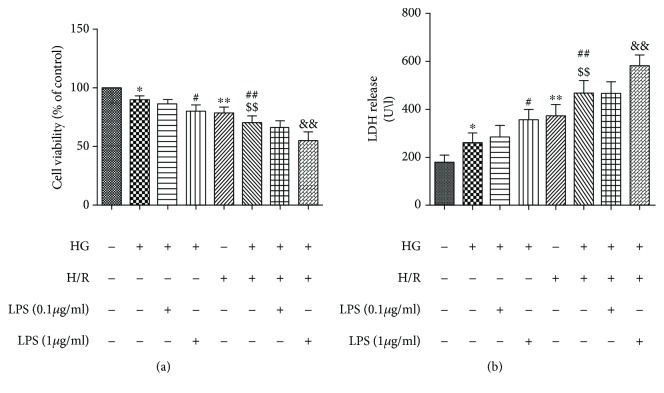
Figure 1.
Dose-dependent effects of LPS on cellular viability and LDH release in H9C2 cells under HG and H/R condition. A “+” symbol indicates presence and a “−” symbol indicates absence of the relevant treatment condition. Cell viability was detected by CCK-8 assay (a). The LDH release was detected by LDH activity assays (b). Data are expressed as mean ± SD (n = 6). ∗P < 0.05 and ∗∗P < 0.01 versus control; #P < 0.05 and ##P < 0.01 versus HG; $$P < 0.01 versus H/R; &&P < 0.01 versus HG+H/R.

