Figure 6.
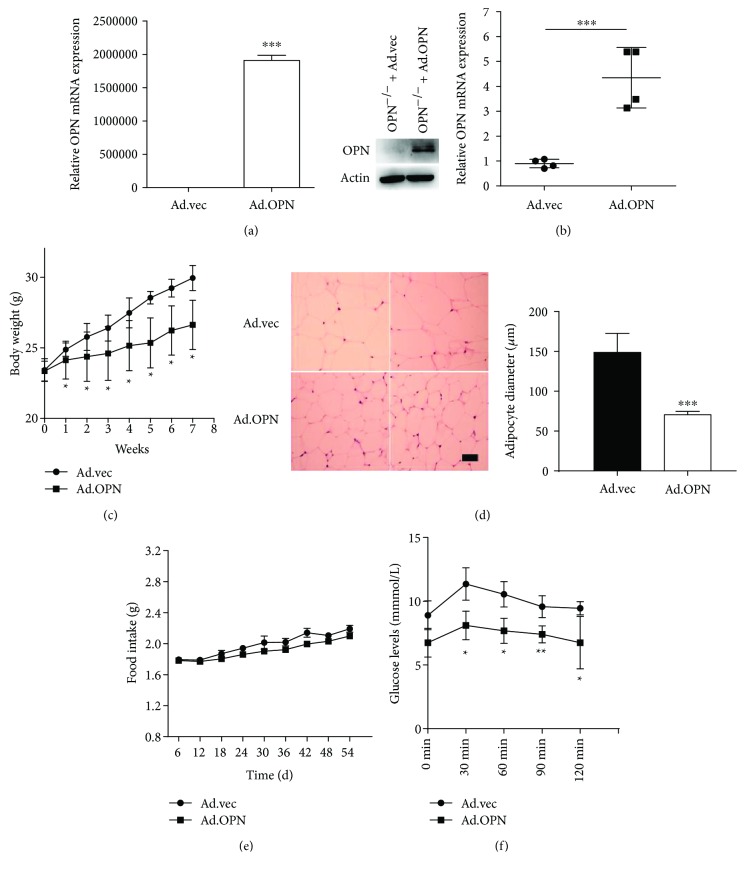
Effects of OPN on body weight of C57BL/6 obese mice induced by high-fat diet. (a) OPN−/− ASCs transfected with OPN adenovirus (Ad.OPN) or control adenovirus vehicle (Ad.vec) were analyzed for OPN mRNA and protein for 3 days after transfection, to verify efficiency. (b) OPN mRNA level in ASCs from Ad.OPN and Ad.vec 8 weeks after OPN infection. (c) Weight change in the two groups of mice. (d) Representative images of H&E staining of subcutaneous adipose tissue from control Ad.vec mice and Ad.OPN mice (bar = 50 μm), and the average diameter of adipocytes was quantification analyzed by ImageJ. (e) Food consumption was determined by measuring the difference between the amount provided and the amount left every three days. Food intake per mouse was calculated based on the amount consumed divided by time and the number of mice per cage. (f) Time-dependent blood concentration of glucose upon i.p. injection of glucose (1.5 g/kg) 8 weeks after OPN infection. Values are means ± SEM. ∗ P < 0.05; ∗∗ P < 0.01; ∗∗∗ P < 0.001.

