Figure 5.

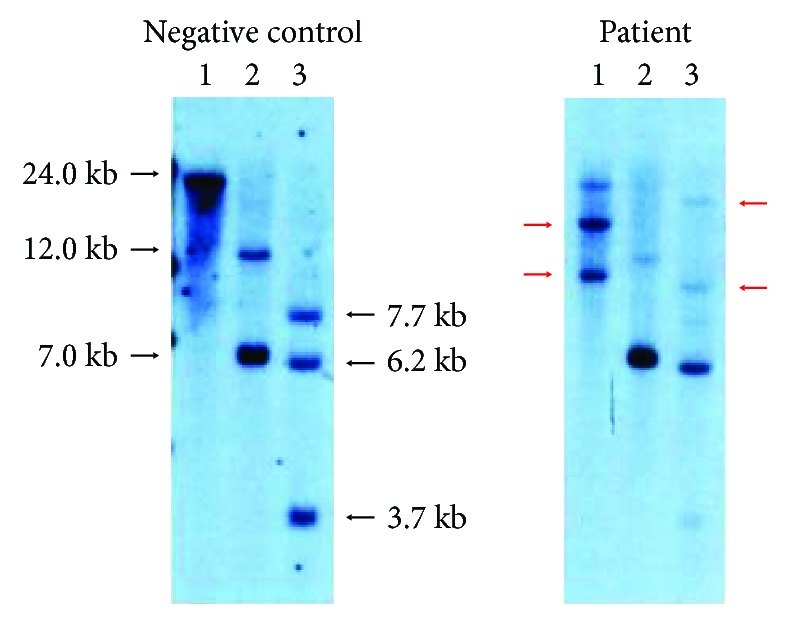
Southern blot analysis of HTLV-1 provirus DNA depicted two bands (red arrows) in after BamH-I digestion and two bands (red arrows) after Hind III digestion. 1: BamH-I; 2: EcoR-V; 3: Hind III.

Southern blot analysis of HTLV-1 provirus DNA depicted two bands (red arrows) in after BamH-I digestion and two bands (red arrows) after Hind III digestion. 1: BamH-I; 2: EcoR-V; 3: Hind III.